New 3D images give never-seen-before views inside New Zealand’s largest fault

Media Release

17 August 2023

Web Heroes 2023 08 15T150153.449

New research has revealed the first ever 3D images of the Northern Hikurangi margin - and how New Zealand's largest fault moves.

Subduction zones produce the largest earthquakes in the world

Aotearoa New Zealand's largest fault, the Hikurangi Subduction Zone (HSZ), is where the Pacific tectonic plate dives west beneath the Australian plate and underneath the east coast of the North Island.

In some parts of the subduction zone, GPS instruments are showing the plates slowly move by a few millimetres a year. This behaviour is called a "slow slip" and occurs over periods of weeks or months. However, in other parts the plates are stuck, locked together, and building up pressure.

By understanding the structural factors that create the smoother slipping and stuck zones, scientists are seeking to better diagnose what areas could generate potential future earthquakes and tsunami. As Aotearoa's largest source of potential earthquakes and tsunami, its critical to be able understand the HSZ in high-resolution detail.

gase et al NZ3D rev
Tectonic setting of the northern Hikurangi margin. (A) Regional map showing the extent of the Hikurangi Plateau (blue polygon) and major tectonic plate boundaries (red lines) in the southwest Pacific. (B) Bathymetric map showing the deformation front of the Hikurangi margin (red line) Credit: Andrew C. Gase, University of Texas at Austin.

New 3D images reveal hidden structures in the Hikurangi Subduction Zone

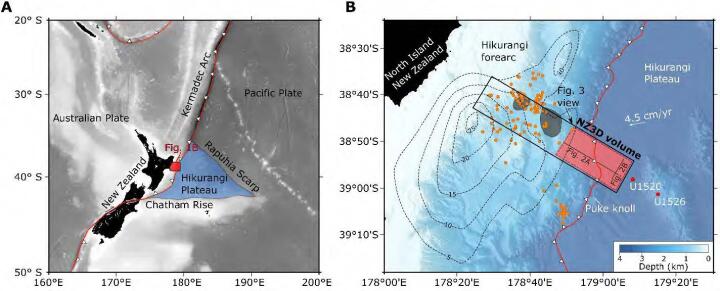
In 2018 a collaboration of researchers from USA, Japan, UK, and GNS Science used the RV Marcus Langseth to record numerous overlapping race-track "seismic reflection data" lines. The data were gathered together alongside deployments of ocean bottom seismographs and onshore seismometer in a effort called the "NZ3D" survey.

In an international collaborative effort spanning three recent high-profile publications, the first ever spectacular 3D seismic images of the northern part of Hikurangi margin have now documented new insights for understanding the structural, stratigraphic and hydrogeologic characteristics of the HSZ. Understanding these qualities, specifically how they transport fluids, are key to knowing the conditions that lead to generation of subduction earthquakes.

Model of Magnitude 8.9 Hikurangi Earthquake and Tsunami transcript

Leading New Zealand scientists have designed a credible scenario for an earthquake and tsunami on the Hikurangi Subduction Zone.

The scenario, further developed by GNS Science experts, helps emergency responders to plan and prepare for a magnitude 8.9 earthquake and tsunami on the Hikurangi Subduction Zone which is off the east coast of the North Island.

The scenario shows impacts from the earthquake and tsunami for the most effected areas across the North Island's East Coast in New Zealand.

It is one of many possible scenarios and does not predict the future. It is unlikely that a Hikurangi Subduction Zone earthquake and tsunami will happen exactly like this.

This scenario is based on a magnitude 8.9 earthquake and shows the potential levels of ground shaking. The earthquake's rupture begins 70 kilometres off the coast Porangahau, Hawke's Bay at a shallow depth of nine kilometres.

An earthquake like this would release around 45 times more energy than the 2016 magnitude 7.8 Kaikoura Hurunui earthquake.

The scenario is run at double the actual speed and the scale bar shows the level of shaking. White shows extreme shaking and red shows strong to severe shaking.

The earthquake rupture continues north and south creating long and strong shaking along the east coast of the North Island.

Gisborne would experience particularly strong and long shaking in this scenario due to the different rock types in the area that increase the shaking's intensity and duration. 

Wellington would feel ground shaking 90 seconds after the initial earthquake rupture.

Areas further away from the earthquake rupture would experience strong shaking.  For example Auckland though a good distance away would experience around 30 seconds of severe shaking.

As well as the shaking the earthquake would potentially cause liquefaction, landslides and fires in some areas.

The sudden movement of the sea floor during the earthquake causes a lot of water to move creating a tsunami.

The scenario is now showing the tsunami created by this large earthquake. Within the first few minutes there are rapid changes in sea level along the east coast of the North Island.

The tsunami moves in all directions.

After the earthquake rupture some parts of the coast may see a rise in sea level shown in red. In others such as Hawke's Bay in this scenario the sea-level would rapidly decrease, pulling away from the coast and returning with enormous speed and force when the tsunami waves arrive.  This is shown in blue.

This is because the ocean first draws down and sucks water away from the coastlines to later return.

Close to the shore along the East Coast waves could reach about ten metres above normal sea level in some places. In a few locations where the tsunami is funnelled into steep valleys on shore it might reach even higher, possibly up to 20 metres above sea level. 

In some other earthquake scenarios run-up heights could be even greater than 20 metres at some locations. Tsunami evacuation zones account for multiple possible earthquake scenarios.

In this scenario the speed the tsunami waves travel means there would not be enough time for an official evacuation warning.

The long or strong earthquake is your signal to self-evacuate all tsunami evacuation zones.

Check your tsunami evacuation zones on your local civil defense group website.

Make sure that you and your family and others who rely on you know your evacuation route to higher ground or inland whether you're at home, at work, at school or out and about.

In this scenario around 13 minutes after shaking begins in Wellington large tsunami waves arrive at the harbour entrance and extend into the tsunami evacuation zones. It's important to evacuate all tsunami evacuation zones in a long or strong earthquake.

The scenario is sped up to show how the tsunami moves in the first two hours of the earthquake.

The tsunami would reach cities as far away as Auckland, Christchurch and even the West Coast of the North Island.

While this and other science-based scenarios do not predict the future and a single scenario

cannot provide all the answers on its own, they help emergency managers to plan and prepare for events like a Hikurangi subduction zone earthquake and tsunami.

To get prepared visit getready.govt nz

To check your tsunami evacuation zones visit your local civil defense emergency management website.

Model of Magnitude 8.9 Hikurangi Earthquake and Tsunami

This scenario helps emergency responders to plan and prepare for a magnitude 8.9 earthquake and tsunami on the Hikurangi Subduction Zone.

Seamount
A cutaway 3D seismic image of Pāpaku Seamount (grey bulge in center). The seamount is located near New Zealand’s Hikurangi subduction zone and lies over 3 miles beneath the seafloor. Researchers at the University of Texas Institute for Geophysics found that seamount collisions with subduction zones might influence earthquake activity. Credit: University of Texas Institute for Geophysics/Nathan Bangs
  • How the 3D images were created

    Seismic reflection data are typically how geophysicists visualize the crust. To capture this data a specialist vessel, in this case the R/V Marcus Langseth, tows an array of individual sound sources that are tuned and combined to radiate a sound wave downward to the seafloor. The echoes that bounce back from layers in the earth are recorded on a streamer towed behind the vessel and on sensitive seismographs located onshore and on the seabed. 

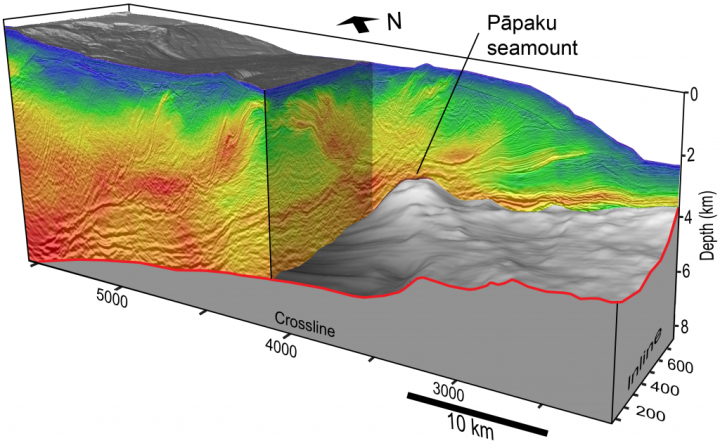
    While a grid of 2D profiles is good enough to identify major plate boundary structures, this high-resolution 3D data are needed to visualize details within subduction zones to improve understanding of fault geometry and slip behaviour. The 3D data are combined in a CAT scan image of the subduction zone that shows the architecture and properties of the boundary between tectonic plates can contribute to variability in the location of strong and seismogenic versus weak slipping segments.

    The 3D data provides new constraints on the physical conditions and rock properties to inform computer simulations and forecasts of earthquake ground shaking and tsunami inundation that greatly help improved hazard preparedness and response.

How fluids and underwater volcanoes influence how New Zealand's largest fault moves

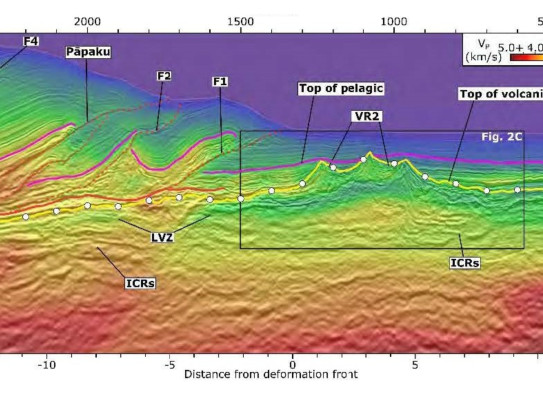
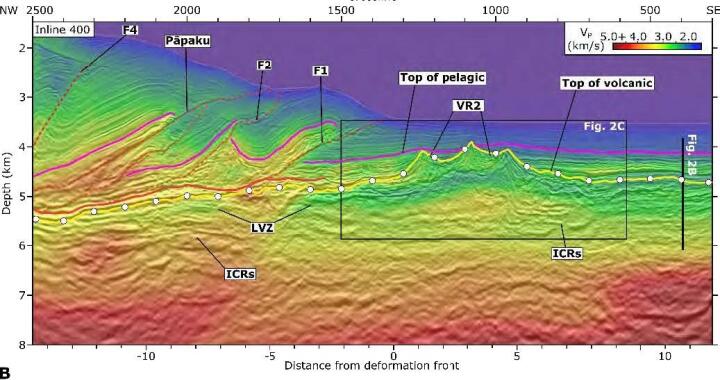
In June a Nature Geoscience paper reports how the NZ3D data capture a seamount (underwater volcano) caught in the act of subducting beneath the shallow part of the Hikurangi margin and forms sediment lenses in its wake that appear to enhance slow slip.

Further, in a Geology paper the NZ3D data reveal a detailed map of the deeper parts plate interface that shows that it has kilometer-high hill and valleys. The new NZ3D data show that the plate interface may strongly govern the nature of how the margin deforms, including the localization of both slow slip and hazardous fast-slip earthquakes.

gase et al NZ3D rev2A
Seismic profiles from the NZ3D reflection and velocity volumes showing volcanic features and faults in the overthrusting plate. The yellow line with white circles is the top of volcanic basement. Magenta line is the top of pelagic units. Red solid line highlights the megathrust. Red dashed lines highlight thrust faults that separate accreted thrust sheets. Credit: Andrew C. Gase, University of Texas at Austin.

Most recently, a Science Advances paper revealed a previously hidden water reservoir within the layers of the Pacific plate being swallowed up in the subduction process.  The new finding suggests that subducting plate of volcanic rocks act as amplified source of water that influences the slip behaviour of the margin. The trapped water is under pressure and results in the plate boundary being weak and prone to unlocking and sliding in slow slip. The study highlights the presence of significant water delivery to slow slip source from the incoming Pacific, that were previously unknown.

Importantly, we are able to pinpoint the location of water rich layers, that allow smooth slipping, versus other water-poor segments that are stuck and will likely rupture in fast earthquakes.

Dr Stuart Henrys Project Lead and Principal Scientist GNS Science
140423 Stuart henrys GNS Science
Project lead from GNS Science, Dr Stuart Henrys, pictured with ocean bottom instruments ready for deployment.

Revealing the mysteries of the subduction process in ways never possible before

The hope is that these new generation 3D images will be able to identify areas of the plate boundary where water rich layers enable smooth slip and other areas that are locked and stuck.

By understanding how the slip behaviour varies along the subduction zone, it allows scientists to better diagnose and pinpoint areas that are more prone to generate large earthquakes.

Our 3D data also provides new constraints on the physical conditions and rock properties to inform simulations of earthquake ground shaking and tsunami inundation that greatly help improved hazard preparedness and response.

These results represent another piece in the puzzle that we can start using in our large-scale earthquake cycle simulations

Bill Fry Seismologist GNS Science

This research was supported by New Zealand Ministry of Business Innovation and Employment, USA National Science Foundation, UK Natural Environment Research Council and Japan Agency for Marine-Earth Science and Technology.

By continuing with this download you agree to abide by the rules laid out in the Terms and conditions/Terms of use listed on this page.

If there are no specific Terms and conditions/Terms of use listed then please refer to our Copyright and Disclaimer page and Privacy Policy page

Download