
Revolutionising ground movement monitoring in New Zealand - INSAR
How measuring millimeters from space is possible.
GNS has recently partnered with SatSense to provide an exclusive time series Interferometric Synthetic Aperture Radar (INSAR) dataset across all of Aotearoa.
GNS has recently partnered with SatSense
Together we are working to provide an exclusive time series InSAR dataset across all of Aotearoa. Derived from ESA Sentinel-1 data the nationwide dataset covers a timespan from 2014 until present with near-real time updates occurring every 12 days.
This dataset opens many new opportunities for applications within both research and industry for monitoring deformation on huge scales with high spatial resolution down to the millimetre accuracy. Before we dive into all of the potential use cases it may help to explain both conventional InSAR and time series InSAR to understand how measuring millimetres of movement from space is even possible.
What is InSAR?
InSAR (Interferometric Synthetic Aperture Radar) is a technique for mapping ground deformation using space-borne radar images of the Earth's surface.
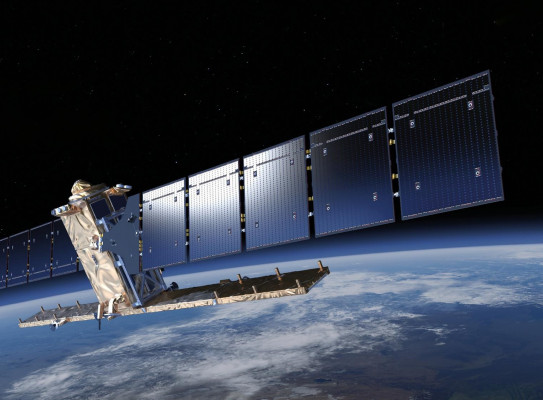
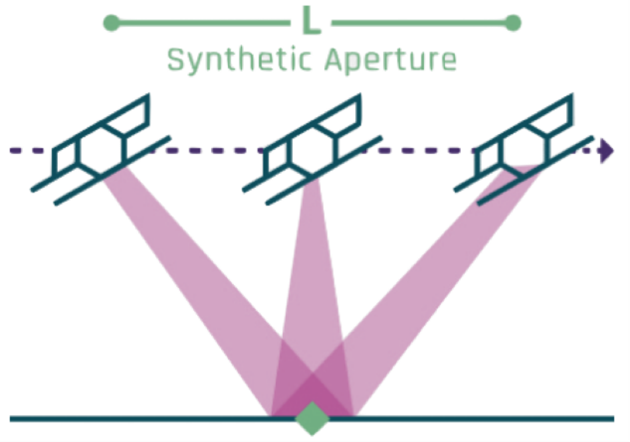
Starting with the inputs to InSAR which are SAR (synthetic aperture radar) images. SAR images contain information on both the amplitude and phase of space-borne radar returns from natural terrain or manmade structures on the Earth. Synthetic aperture simply refers to the fact that many radar acquisitions are stitched together to produce a synthetically created long aperture required to achieve the necessary spatial resolution for the ~700km distance to the ground from space. Unlike optical satellites, SAR can see through clouds and operate both day and night.

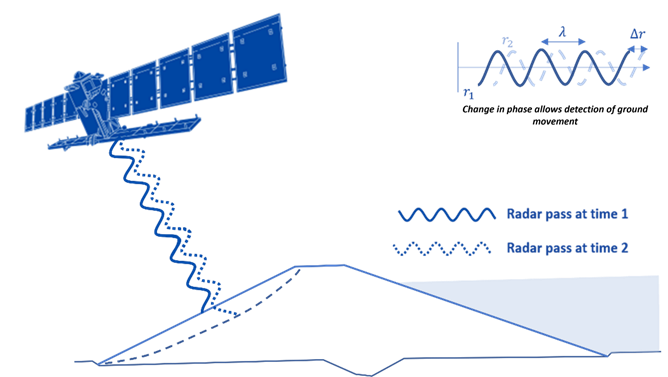
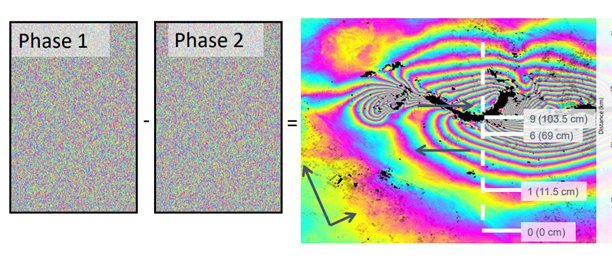
By exploiting the phase component of SAR images, we can perform interferometry on two SAR images to produce an interferogram (or InSAR image) that represents the phase difference from each pixel of the original SAR images. Given the radar wavelength, this difference in phase (interferometric phase) can be translated into a distance measurement representing the change in range distance between the satellite and the ground.

What is time series InSAR?
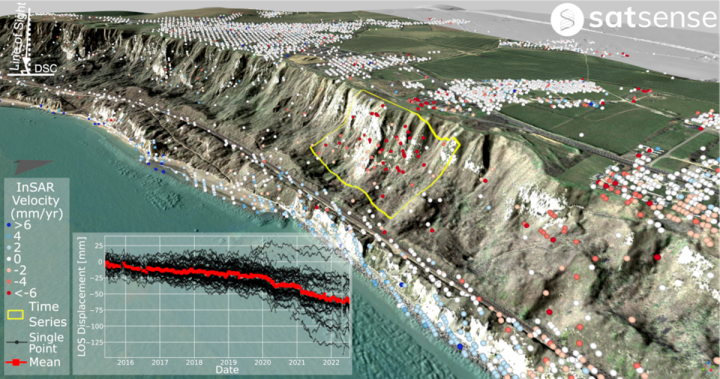
Time series InSAR uses many interferograms, resembling a stack, to generate time series of individual pixels showing how interferometric phase varies over time. This helps us to build a picture of the long-term deformation in regions down to the single pixel level (5 x 20m). Using many interferograms across time allows us to improve the estimation of the deformation signal. Further inputs such as atmospheric and topography models help us remove noise sources allowing accuracy down to the level of millimetres per year.


What are the applications of time series InSAR?
There are many sectors time series InSAR can contribute to for the purpose of monitoring, classifying, and forecasting deformation. Some of these include:
- Geotechnical – risk management for large infrastructure projects
- Water resources – dams and pipelines, aquifer/water table depletion
- Infrastructure – major road and rail networks
- Property/Insurance – residential and commercial buildings
- Geothermal & Natural Gas – pipelines and site injection
- Mining – tailings dams
Time series InSAR can also support crucial science & research questions where building a larger scale understanding of temporally extended processes that drive deformation is key. Such areas may include:
- Volcanic unrest
- Inter/co/post-seismic deformation
- Slow moving landslides
SatSense are working with GNS Science to use InSAR on a case-by-case basis in New Zealand.
Contact us to discuss the requirements for access to the data sets.