Using our geological maps
Our geological maps are available in many formats, ranging from printed paper to digital only. The digital formats also vary from images to map software files to 3D geological models. Our geological maps have rich and complex layers of information within them, and we provide resources and utilise international geoscience information standards to help understanding of their content.
-
Printed and printable geological maps
Geological maps are still printed on paper where there is sufficient anticipated demand. In most cases, geological maps are provided in printable formats although these require large format plotters that are available at print shops. Printed and printable geological maps can be obtained via the GNS Science Online Shop(external link).
-
Web map applications
Geological web map applications provide convenient internet browser access to geological map data. These applications utilise digital versions of the geological maps. Geological data can be viewed in their topographic contexts for an area of interest in a geological map-specific application or in relation to other geoscience data across the Zealandia continent(external link).
-
GIS datasets
Since 1997, our geological maps have been constructed using Geographic Information Systems (GIS) software. The underlying data are available in GIS file formats for use in GIS software such as ArcMap, ArcGIS Pro, QGIS and MapInfo. These digital GIS map files are available for download for some maps and through web service(external link) streaming into local devices.
-
Historic geological maps
The Regional Geological Map Archive and Datafile, one of our Nationally Significant Collections and Databases, includes a large holding of published geological maps and unpublished fieldsheets of Aotearoa New Zealand dating back to the late 1800s. Each map has been scanned and made freely available through a data catalogue and image server for viewing and download(external link), with georeferenced versions available for inclusion in GIS applications.
-
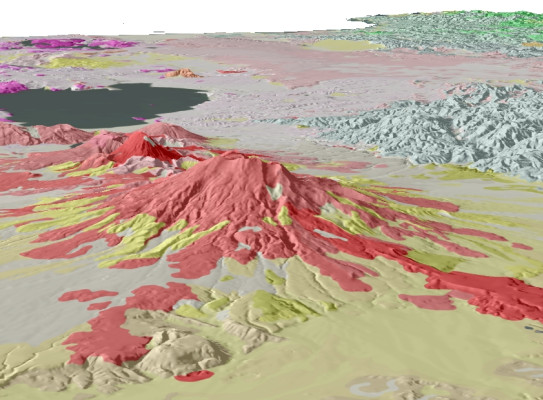
3D geological models
Some of our geological map products include 3D geological models. These typically model geological units as stacked volumes, commonly displaced by fault surfaces. Each unit and fault can be made visible/invisible and the model can be rotated and sliced. The geological models are provided in Leapfrog Viewer(external link) file formats for use in freely downloaded viewing software.
-
Data licence and conditions of use
Unless stated otherwise, our geological maps are licensed under Creative Commons Attribution 4.0 International (CC BY 4.0) terms. This enables users to obtain, transfer, modify and publish our geological map data providing GNS Science is acknowledged as the original source of the data. The geological maps have Crown Copyright.
-
Data layers and code lists
The GIS datasets associated with our geological map products typically consist of many different geological feature layers such as geological units, geological boundaries, faults and structural measurements. These layers are described through metadata records in the GNS Science Dataset Catalogue(external link) and the feature layers have standard names and data structures. The feature layer content includes standardised terminology drawn from code lists(external link), many of which are internationally-adopted vocabularies.
-
Interoperability
Our digital GIS geological maps have incorporated international geoscience information standards, including conformance to the GeoSciML Lite(external link) data model and use of CGI vocabularies(external link). These standards allow integration and linking with offshore data resources such as the international OneGeology(external link) and Macrostrat(external link) web map applications.
What is a geological map?
Geological maps show where different rock types, faults and many other geological features occur, against a background of rivers, coastline, roads and other topographic features. A geological map provides descriptions and the context of these features through a geological legend and cross sections that display subsurface relationships.
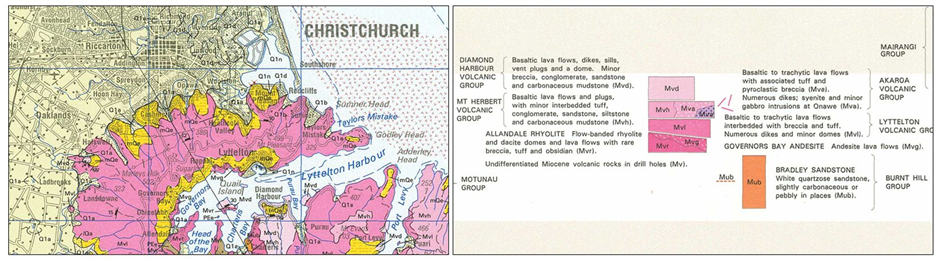
The rock types are typically subdivided according to their depositional or emplacement age and their composition. Each mapped geological unit represents rocks with internally similar characteristics. Their boundaries with other units may be shown as depositional, faulted or intrusive contacts. Geological maps usually omit thin surface layers such as soil and volcanic ash to highlight thicker near-surface units. Faults are typically portrayed in terms of their type, accuracy of location and whether they are active with additional digital information on their age(s) of movement, displacement and orientation. There are many other geological feature types that may be shown; these include folds, horizons, dikes, veins and structural measurements, as well as specific geological units such as landslides and metamorphism. Geological maps are used for regional applications such as hazard assessment and resource exploration but should not be used for site-specific purposes, such as designing the foundations of a building.
How are geological maps put together?
- Acquire new ground-based observations of rock outcrops along coastlines, rivers, cliffs, ridge crests and road cuts.
- Combine field data with existing geological map information and interpret with new and existing paleontology, petrography, geochemistry and geochronology.
- Develop a stratigraphic scheme for the map that organises the required geological units.
- Extrapolate and interpolate geological units and faults based on observations using structural analysis and geomorphic interpretation of aerial photographs, digital surface models, satellite imagery and airborne geophysics.
- Capture, assemble and print maps using computer software.
Typically, the whole process takes 3-6 years per map.
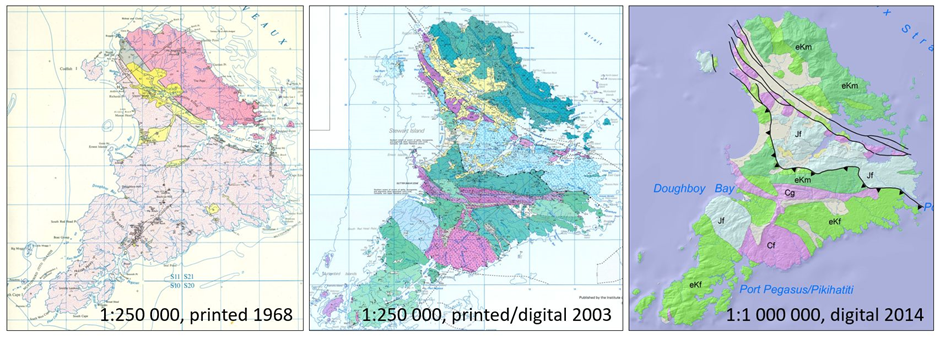
Why do geological maps of the same area look different?
Geological maps are interpretations based on available observational data and current understanding of geological processes at the time they were made. Inevitably geological maps lose currency with the acquisition of information and new understanding. So while rocks don’t change (other than extremely slowly), our knowledge and interpretation of them does. Geological maps are also tailored for their scale and extent; small scale maps covering a wide area have simplified known geological complexity in order to portray geological feature clearly.