Tsunami DART observations and simulation of the 11 November 2022 Tonga Mw 7.4 earthquake
Tsunami DART observations and simulation of the 11 November 2022 Tonga Mw 7.4 earthquake
By A. Gusman, X. Wang, D. Burbidge and B. Fry
At 10:48:45 UTC on 11 November 2022, a magnitude Mw 7.4 earthquake occurred offshore Tonga, in the outer-rise of Tonga subduction zone (USGS(external link) Epicentre 19.318°S 172.100°W).
Data recording the ground shaking from the earthquake arrived at the New Zealand 24/7 National Geohazards Monitoring Centre (NGMC) within minutes of the earthquake and triggered activation of the New Zealand Tsunami Expert Panel. Fortunately, analysis of this event quickly determined that it didn’t pose a credible tsunami threat to New Zealand, but it did leave the GNS Science 24/7 monitors on heightened alert, watching for any tsunami evidence if and when it arrived at the New Zealand DART tsunami detection network. Spoiler alert, it did!
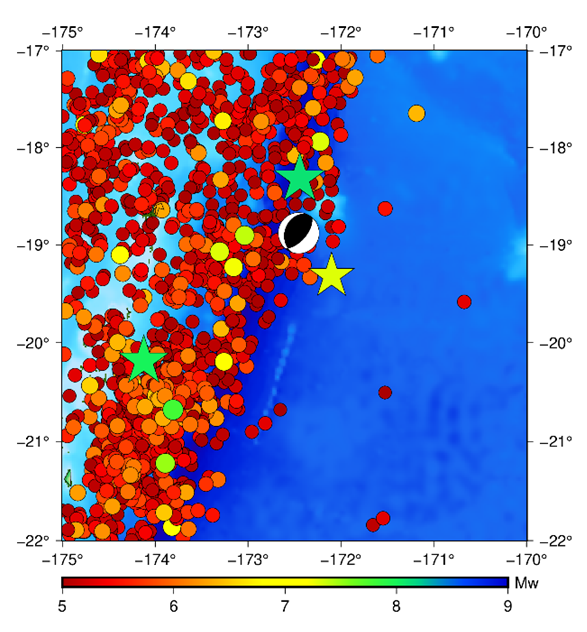
The location of this earthquake compared to previous events above Mw 5.0 located in the area since 1900 is shown in Figure 1. The USGS location for 11 November 2022 earthquake is shown by the yellow star and lies close to the eastern edge of the majority of the previous seismicity in the area.
Research into the statistics of earthquakes in the SW Pacific, including the area around Tonga, has suggested that on average an M8.5 earthquake happens about every 50 years. This is of great concern to New Zealanders, as these earthquakes have the potential to produce devastating tsunamis that might reach New Zealand shores within a few hours. The area that produced Saturday’s earthquake has experienced two earthquakes above Mw8.0 since 1900. A 1911 earthquake with an approximate magnitude of 8.1 located just to the north of the epicentre of the recent event and a Mw8.0 earthquake in 2006 located to the southwest of it (green stars on Figure 1). The 2006 earthquake created a non-damaging tsunami that was large enough to be observed across the Pacific (Tang et al, 2008). The largest observed tsunami from this event was at Pago Pago, American Samoa and at Crescent City, California (maximum amplitude 0.54m in both cases). The earthquake shaking from this event caused minor damage in Nuku`alofa, Tonga and was felt as far south as Wellington, New Zealand (USGS. “M8.0 – Tonga”. United States Geological Survey)(external link). Finite fault models suggest that this 2006 earthquake was a shallow dipping thrust event, most likely on the plate interface where the Pacific plate subducts underneath the Australian plate (Hayes et al, 2017).


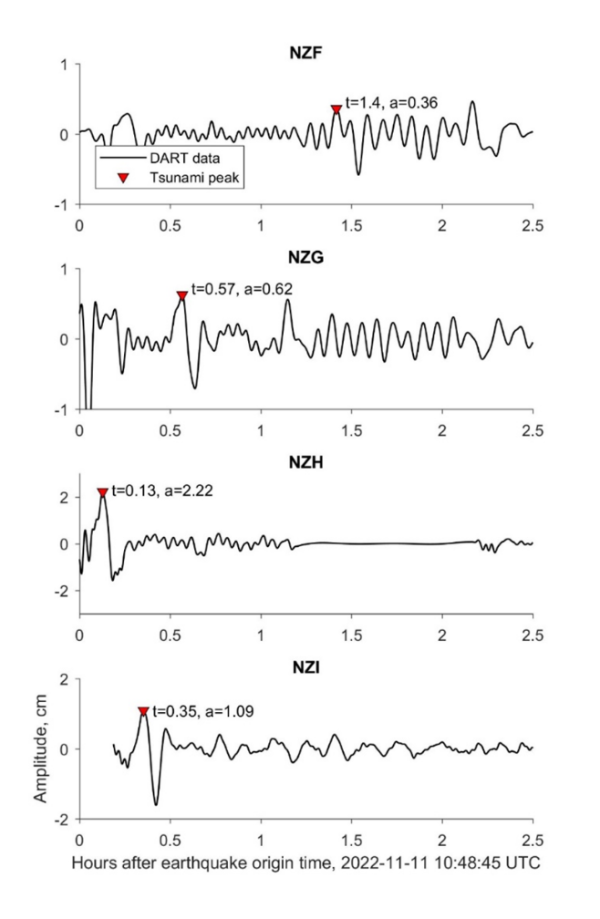
The reverse faulting earthquake that occurred on 11 November 2022 also generated a tsunami. The tsunami was large enough to be clearly observed by New Zealand DART stations NZF (0.36 cm), NZG (0.62 cm), NZH (2.22 cm) and NZI (1.09 cm) (Figure 2) and at the coastal gauge stations at Pago Pago in American Samoa and Ouinné in New Caledonia. The tsunami at Pago Pago(external link) had an approximately maximum tsunami amplitude of about 10 cm, while the maximum observed peak-to-trough height across the DART network was approximately 4 cm at NZH (Figure 2). The data for the Pago Pago station is available from International Oceanographic Commission(external link) and the DART observation data is available from GEONET(external link) (2022). The arrival time and tsunami peak amplitude recorded at all the DARTs where a signal could be observed are shown in Figure 2. The tide and high frequency waves were removed from the original records with a bandpass filter to retrieve the tsunami waveforms.
To better understand the tsunami potential of this earthquake and learn lessons for future similar events, we have developed a simulation of the tsunami generated on the 11 Nov 2022. We simulated tsunami waveforms from the November 2022 event using a preliminary focal mechanism model produced based on the W-phase method of Kanamori and Rivera (2008). The implementation of the method is currently under test as part of the Rapid Characteristic Earthquake and Tsunami programme(external link) at GNS Science and in most cases provides a robust estimate of the ability of an earthquake to generate a significant tsunami within about 20 minutes of the earthquake’s occurrence. The details of the GNS-RCET W-phase focal mechanism obtained using 18 minutes data are shown in Figure 3a. Both nodal planes from the solution were used to create single fault plane models for the tsunami simulations. The theoretical travel time to the DART stations is shown in Figure 3b.
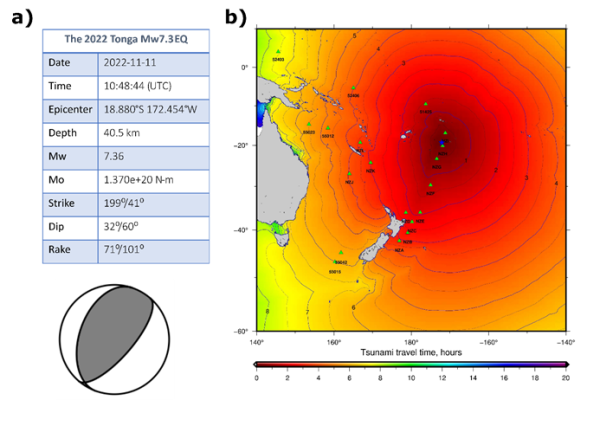
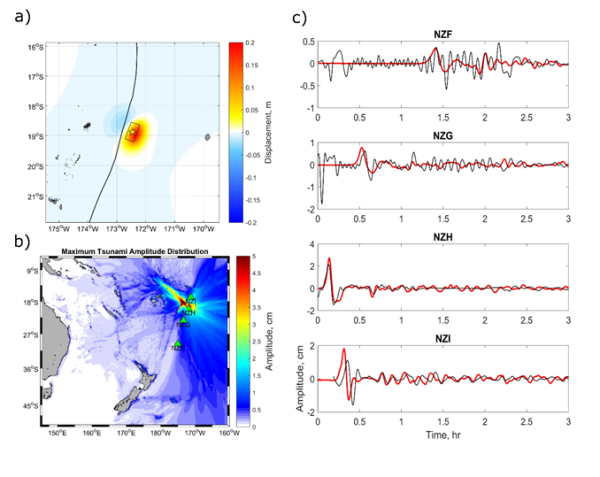
The first nodal plane from the W-phase focal mechanism gave a slightly better fit to the observed tsunami waveforms. This slightly better model has fault strike of 199°, dip of 32°, rake of 71°, and central depth of 40.5 km. Details of the other nodal plane are provided in Figure 3a. Fault length and width were estimated as 66 km and 39 km, respectively, based on a magnitude-to-fault-dimension relationship proposed by Blaser et al. (2010). A uniform slip amount of 0.8 m was used based on the earthquake magnitude, fault area and an assumed rigidity at the centroid depth of 6.54 × 10¹⁰ Pa based on PREM (Dzienwonski and Anderson, 1981). The seafloor displacement is calculated using the model of Okada (1985) (Figure 4a) and used as the initial condition for tsunami simulations.
A tsunami numerical model that can solve the linear shallow water equations (Satake, 1995; Gusman et al., 2010) was then used to simulate the tsunami. The digital elevation model (DEM) used for the tsunami propagation was GEBCO 2014 (Weatherall et al., 2015; https://www.gebco.net/(external link)) and the model was run at resolution of 2 arc minutes. The simulated long waves are then corrected using the Watada et al. (2014) method to include dispersion effects.
The simulated tsunami waveforms from this nodal plane can reproduce the observations at the DART stations NZF and NZH quite well, particularly at NZH. The fit at NZG and NZI are not as good as the other two, with the simulated peak amplitude at NZI arriving 3 minutes earlier and 60% higher than the observation. The simulated and observed tsunami waveforms are compared in Figure 4c. The simulated maximum tsunami amplitude distribution is shown in Figure 4b. The excellent fit to the data, particularly at NZH, and the focal mechanism suggests that this event was a deep outer rise thrust earthquake caused by compressional stresses near the base of the plate as it bends towards the subduction zone. This is similar to what has been observed on other parts of the Tonga margin and elsewhere at other subduction zones around the world (Craig et al, 2014). The Kermadec-Tonga subduction zone is particularly notable for the relatively high rate of outer-rise seismicity, particularly deeper compressional ones similar to this earthquake (Craig et al, 2014). The 2022 earthquake (Mw 7.4) is the largest instrumentally recorded compressional outer-rise earthquake in the region within a radius of 200 km from the epicentre.


The tsunami was large enough to be clearly observed by New Zealand DART stations
How to cite :
Gusman AR, Wang X, Burbidge DR, Fry B. 2022. Tsunami DART observations and simulation of the 11 November 2022 Tonga Mw 7.4 earthquake. Lower Hutt (NZ): GNS Science; [accessed date]. https://doi.org/10.21420/DD16-XK63(external link).
-
References
Blaser, L., Krüger, F., Ohrnberger, M., & Scherbaum, F. (2010). Scaling relations of earthquake source parameter estimates with special focus on subduction environment. Bulletin of the Seismological Society of America, 100(6), 2914-2926.
Craig, T.J., Copley, A. & Jackson, J. (2014). A reassessment of outer-rise seismicity and its implications for the mechanics of oceanic lithosphere. Journal of Geophysical Research, Geophysical Journal International, 197, 63–89.
Dziewonski, A. M., & Anderson, D. L. (1981). Preliminary reference Earth model. Physics of the earth and planetary interiors, 25(4), 297-356.
GEONET, 2022, https://www.geonet.org.nz/tsunami/dart(external link)
Gusman, A. R., Tanioka, Y., Kobayashi, T., Latief, H., & Pandoe, W. (2010). Slip distribution of the 2007 Bengkulu earthquake inferred from tsunami waveforms and InSAR data. Journal of Geophysical Research: Solid Earth, 115(B12).
Hayes, G.P., Myers, E.K., Dewey, J.W., Briggs, R.W., Earle, P.S., Benz, H.M., Smoczyk, G.M., Flamme, H.E., Barnhart, W.D., Gold, R.D., & Furlong, K.P. (2017). Tectonic summaries of magnitude 7 and greater earthquakes from 2000 to 2015: U.S. Geological Survey Open-File Report 2016–1192, 148 p., https://doi.org/10.3133/ofr20161192.
Kanamori, H., & Rivera, L. (2008). Source inversion ofWphase: speeding up seismic tsunami warning. Geophysical Journal International, 175(1), 222-238.
Okada, Y. (1985). Surface deformation due to shear and tensile faults in a half-space. Bulletin of the seismological society of America, 75(4), 1135-1154.
Satake, K. (1995). Linear and nonlinear computations of the 1992 Nicaragua earthquake tsunami. Pure and Applied Geophysics, 144(3), 455-470.
Tang, L., Titov, V.V., Wei, Y., Mofjeld, H.O., Spillane, M., Arcas, D., Bernard, E. N., Chamberlin, C., Gica, E. & Newman, J. (2008). Tsunami forecast analysis for the May 2006 Tonga tsunami, Journal of Geophysical Research: Oceans, 113, C12015, doi:10.1029/2008JC004922.
USGS, 2022, https://earthquake.usgs.gov/earthquakes/eventpage/us7000ip0l/moment-tensor(external link)
Watada, S., Kusumoto, S., & Satake, K. (2014). Traveltime delay and initial phase reversal of distant tsunamis coupled with the self‐gravitating elastic Earth. Journal of Geophysical Research: Solid Earth, 119(5), 4287-4310.
Weatherall, P., Marks, K. M., Jakobsson, M., Schmitt, T., Tani, S., Arndt, J. E., ... & Wigley, R. (2015). A new digital bathymetric model of the world's oceans. Earth and space Science, 2(8), 331-345.