Cyclone Gabrielle landslide response and recovery
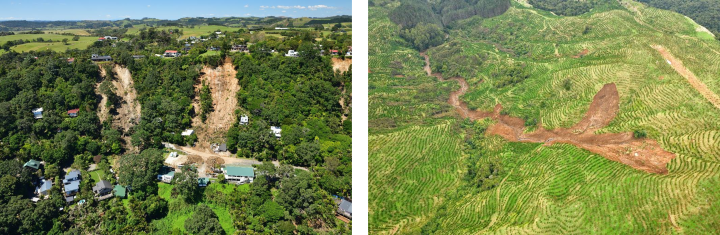
Between 12 and 16 February 2023, Cyclone Gabrielle triggered hundreds of thousands of landslides across the North Island damaging houses, power lines, bridges, roads and creating dams across channels, and sadly, resulting in the death of five people. This is potentially the largest mapped landslide-triggering event on record in Aotearoa.
GNS Science was tasked with identifying, with a good level of spatial accuracy, where rainfall-induced landslides and their damaging impacts were likely to occur, did occur and might occur in the future.
GNS engineering geologists, Drs Chris Massey and Kerry Leith, are leading this work, which is being delivered in partnership with NEMA, Manaaki Whenua, University of Canterbury, and the University of Auckland.
About the project
To identify and map the large number of landslides triggered by Cyclone Gabrielle, the project team developed new mapping and modelling approaches to provide stakeholders with landslide intensity information in a timely manner and at a sufficient level of spatial and positional accuracy to be useful.
The team have mapped more than 160,000 landslides, from which the models indicate across the total region could tally more than 800,000.
This is one of the largest international landslide datasets directly related to a single storm event. This new dataset enables landslide occurrence to be linked to the rain that triggered them, allowing hindcasting of the magnitude of the impacts.
Once the landslide impact models are retrained on this new dataset, they will be used to forecast the potential impacts more accurately for potential future landslide-triggering events. Further, because the models are linked to rain amounts, the influence of climate change on rainfall can also be integrated into the forecasts.


Project phases
- Immediate response: Help stakeholders find where potential landslides may have occurred from the event that could pose a risk to life and lifeline infrastructure.
- Mapping: Develop a systematic approach to the mapping of landslides, balanced against the need for timely information.
- Case studies: Study of a specific landslide dam and two slow-moving landslides posing a risk to urban areas.
- Landslide hazard forecast modelling: Update and improve landslide susceptibility and rainfall-induced landslide forecast and impact models.
Immediate response
Ahead of Cyclone Gabrielle’s landfall, the GNS landslides team forecasted where rainfall-induced landslides were most likely to occur using soil moisture levels and NIWA’s maximum 24-hour rain forecasts projected over a 48-hour period as inputs for the landslide susceptibility models.
The landslide forecasts were overlaid on population and infrastructure maps to create impact forecasts to identify where the greatest risk to life and lifeline infrastructure was likely to be. This critical information was shared with emergency managers, councils, and national infrastructure network providers to support them to direct their resources where they were likely to be needed most.
Once Gabrielle made landfall, the landslide forecasts were continually updated with real-time rainfall data to support emergency managers with time critical information as the cyclone event unfolded.
Watch Chris Massey and Kerry Leith present on the project to the NZ Geotechnical Society
Watch Chris Massey and Kerry Leith present the landslides mapping project to the USGS
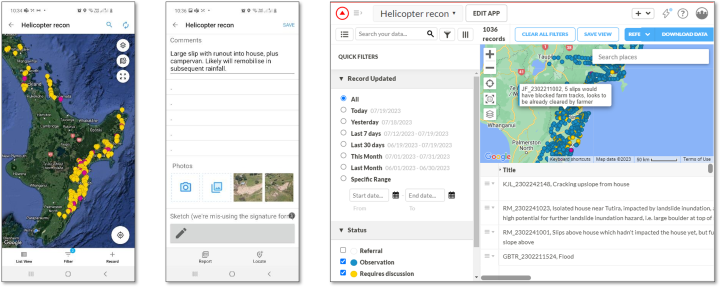
Immediately following Cyclone Gabrielle, the team set out to rapidly identify where landslides and damage had occurred. Reports from media, social media, civil defence, councils, iwi, and infrastructure operators provided a good indication of landslide locations, particularly those among populations.
From this intel, Northland, Auckland, Waikato, Gisborne, Hawke’s Bay and Tararua districts were identified as the most heavily impacted regions to further survey. Five GNS landslide expert teams were assembled to undertake aerial reconnaissance of this 50,000 sq. km area. Nearly 17,000 photos of landslides annotated with observations were taken from the air and georeferenced for later use. These were provided to end users at the end of each aerial mission. The expert teams also swept the area for hidden hazards that may pose a future risk, including landslide dams and failing slopes threatening property and roads in urban areas.
The images, intel and landslide and impact forecasts updated with current rainfall data were shared daily with stakeholders using a custom mobile app so they could respond as needed to prevent further damage and loss of life from landslide hazards.
Mapping
The immense number of landslides, the large area covered, the wide range of geology, climate, land cover and physiology and the speed with which an inventory was needed, required evolved and innovated methods to capture the landslides and their impacts.
A multi-agency team with multi-expertise was essential. At GNS more than 25 staff, ranging from engineering geologists, geospatial analysts, geologic mappers, programmers and social scientists, were assigned to the team. GNS partnered with NEMA, Manaaki Whenua, University of Canterbury, and the University of Auckland to develop a systematic workflow and methodology to create a spatially accurate landslide inventory that could be simultaneously disseminated and useful to end-users on the ground.
Fifteen post-graduate students and two supervisors were included in the team and added incredible value as they were able to work for several months full-time whilst gaining significant landslide mapping and GIS skills, supporting future capability development for New Zealand.
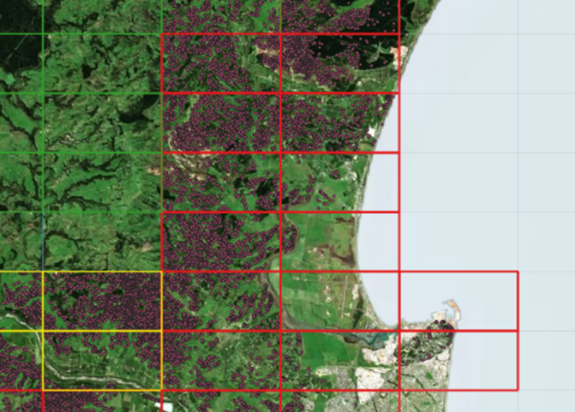
Mapping largely took place in QGIS and ArcMap, which was uploaded to an ArcGIS online web map multiple times a week for stakeholders to access the data quickly. The 50,000 sq. kms of affected area was divided into grid cells of 5 km × 2.5 km, which were ranked based on stakeholder priority. Mapping was based on pre- and post-satellite optical and radar imagery streamed by Land Information New Zealand (LINZ). Stakeholders helped to inform which areas should be mapped as a priority, emphasising the regions where people and lifeline infrastructure were most exposed to landslide hazards.
Quality controls were implemented at several points in the process including independent verification checks by the GNS team and a final quality assurance by two experienced Manaaki Whenua mappers.
End users could access both reviewed and unreviewed layers of data on an online interactive map stored on the GNS cloud. The unreviewed ‘raw’ landslide maps were shared instantly to provide quick data for emergency response. Users could also add valuable information from their own on-ground experiences to further enrich the information being shared.
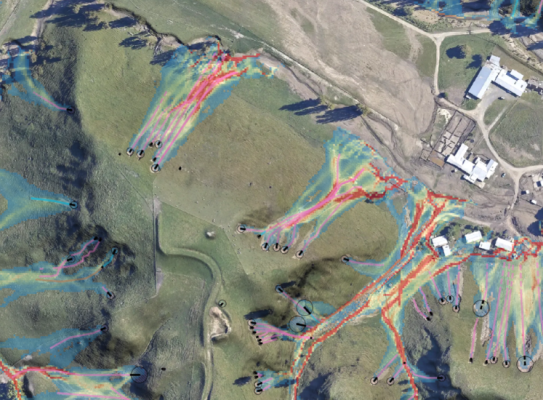
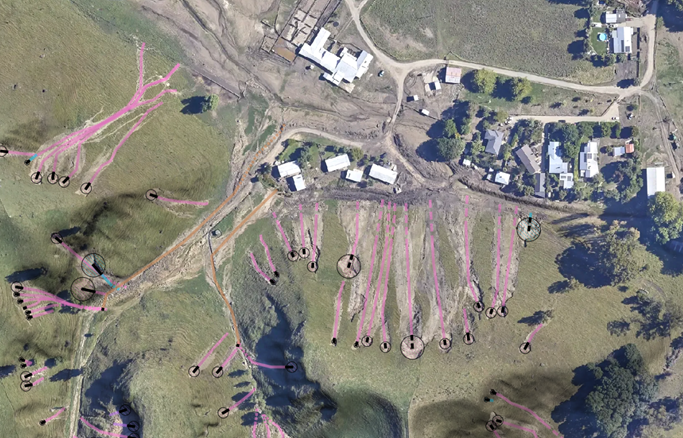
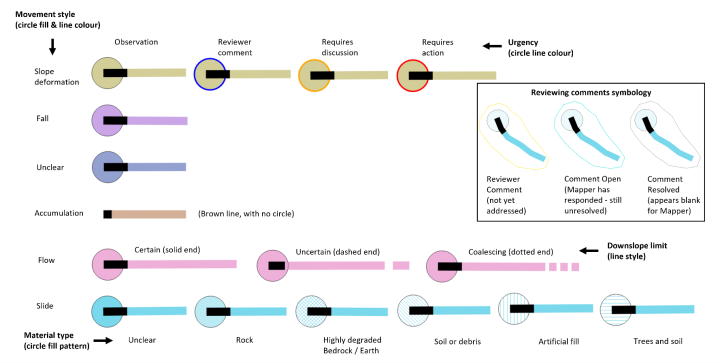
One of the most crucial decisions made was how to map each landslide. The goal was to provide as much detail and data as possible, while also being able to map at least all the top priority grid cells within the given timeframe and budget.
There was debate on whether to use points on a map, oriented polylines or polygons, with/without attributes. Points are quick to map but don’t provide any additional data other than the landslide’s location; polygons provide the most accurate information but take a significant amount of time to map. Using oriented polylines with attributes meant that at least the minimum required high-priority grid cells could be mapped, but still capture important and useful data in a manageable and cost-effective timeframe. With oriented polylines, the first point of the line represents the centre of the landslide source and the polyline represents the centreline of the debris trail, providing some detail on the travel distance of the landslide runout, its direction and possible impacts.
The attributes were aligned with the European and international norms to ensure consistency with existing landslide catalogues.
These include:
- type of landslide as defined by its movement down a slope, e.g., fall, flow, slide
- material type, e.g., rock, soil, artificial fill
- end type, i.e., how clear the end point is from its starting point
- accumulation of a debris trail
- level of urgency for a landslide hazard to be further assessed
In addition to polylines, specific symbology for the landslide attributes was used to assist users in capturing the essential characteristics of each landslide at a glance, while also helping to build a rich dataset needed for building the forecast models.
All this information improves understanding of the mechanisms that trigger a rainfall-induced landslide, as well as how it moves down a slope (e.g., momentum and velocity). For example, improved runout modelling can now be performed to track the path and amount of sediment from debris trails that might damage the environment, including within denser ground cover that cannot be seen from aerial imaging.
Case studies
The GNS landslides team is examining three sites identified as potential hazards to people and infrastructure.
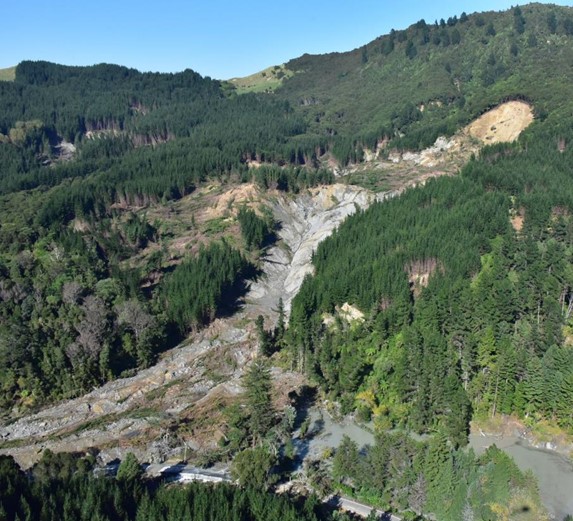
A partial breach of an old landslide that blocks the Mangahauini River three km upstream from Tokomaru Bay occurred sometime during Cyclone Gabrielle.
Field-based mapping and LiDAR surveys (laser technology used to examine the earth’s surface) using drones are being undertaken at the Tokomaru landslide dam at Tokomaru Bay. Investigations are underway to assess its potential impact on downstream areas in the event the landslide dam reforms and breaches in the future.
Two slow-moving landslides in Piha and Waiatarua are being monitored with GNSS (global navigation satellite system networks) movement and rainfall monitoring equipment. These landslides are affecting both residential property and roads.
Advice on the likelihood and impacts of these hazards will be provided to Gisborne and Auckland councils.
Landslide hazard forecast modelling
The current landslide models are built on years of scientific research. While the models performed reasonably well to forecast the most likely affected areas ahead of Cyclone Gabrielle’s arrival, with the addition of over 140,000 landslides there is now a richer dataset to test and retrain current models to better forecast future events.
As mapping continues, the team are concurrently testing how well the modelled forecasts trained on the pre-Gabrielle landslide inventory perform against the actual landslides triggered by Cyclone Gabrielle that have been mapped.
Using automated mapping of landslides generated by external organisations – based on remotely-sensed satellite imagery – to compare against the human-based mapping, around 30 per cent of the mapped source areas from the automated mapping were found to be missed, with around 65 per cent of those being the size of a house or smaller. In some cases, there were mapped landslides that were either bare ground or some other feature unrelated to landslides. This supports the decision to have ‘humans’ map the landslides for this event to better ensure they were fully captured, accurately.
Retraining the landslide forecast models on the pre-existing landslide inventory, plus the input of new human-mapped data from Cyclone Gabrielle tagged with multiple attributes, means more accurate predictions can be made of where landslides might occur, as well as their characteristics and potential impacts down slope.
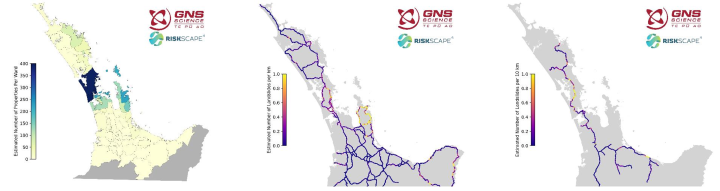
Using a risk analysis tool called RiskScape, this platform allows different hazard datasets to be used with exposure datasets and vulnerability functions to estimate the risks – including the probability of fatality, financial loss or impacts on infrastructure.
This degree of information, teamed with high intensity rainfall models provided by partner organisations, could prove critical to the preparation of frontline services, transport networks and people ahead of the next storm event.
Next steps
The intention is to make the inventory available once the necessary quality checks have been completed. In the meantime, an unprocessed version of the inventory that has not yet undergone quality checks is being shared with end-users and their subcontractors. This preliminary release is intended to assist in the reconstruction efforts in areas impacted by Cyclone Gabrielle. If you require this preliminary inventory for the purpose of informing rebuilding work, please contact the relevant government agency overseeing the reconstruction efforts and request them to obtain a copy on your behalf. Please contact j.bidmead@gns.cri.nz if you have any questions.
Once the landslide susceptibility models have been refined, risk analyses will be expanded to support long-term planning that can greatly reduce New Zealand’s exposure to economic, infrastructure and human losses from both earthquake and rain-induced landslides. These include future land zoning, community safety plans, rail and road planning and many other activities that underpin where and how New Zealanders live.
There are also more than 1,500 homes impacted by Cyclone Gabrielle landslides that require further risk analysis. The retrained models are now being used to help councils and others to undertake that work.
Going forward, the research programme will build on the lessons learned from Cyclone Gabrielle to fill gaps that will go even further to improve the landslide forecast models. These include the role of slope-channel coupling, landcover and soil moisture on landslide triggering and how climate change projections can be incorporated into landslide forecasts.
Funding & aligned research
The Cyclone Gabrielle landslide mapping project received $1.45 million of MBIE funding under the Strategic Science Investment Fund Extreme Weather Science Response(external link) and the GeoNet project.
More information on other Cyclone Gabrielle-related projects can be found on the Extreme Weather Research Platform website(external link), coordinated by the Resilience to Nature’s Challenges directorate. This research is contributing to improving New Zealand’s readiness and resilience against extreme weather events to support a safer, and ultimately more prosperous, future for New Zealand.