
West and East Antarctic Ice SheetsCritical drivers of global sea-level rise
This project aims to determine how these Antarctic ice sheets will respond to a world that is 2°C warmer, and understand the consequences.
Overview
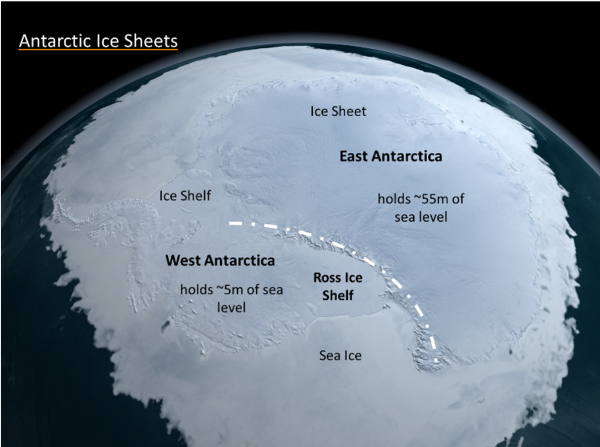
Antarctica hosts two distinct ice sheets:
- The WAIS is largely marine-based, grounded to almost 2,000m below sea level. It’s about 1.9 million km2 in area.
- The EAIS is mostly land-based. It’s about 10.3 million km2.
Together, they hold about 70 per cent of the world’s fresh water. If the WAIS melted, oceans would rise by 5m. If the EAIS melted, oceans would rise by 52 m. What’s more likely is mere centimetres – but still enough to affect hundreds of millions of people with coastal inundation.
We’re looking for the answer one of the most critical questions in Antarctic research: Did the WAIS collapse during the last interglacial period? If it did, we may find out what our future will look like from ice cores from the Roosevelt Island Climate Evolution project (RICE)(external link)
Rapid deglaciation of the West Antarctic Ice Sheet (WAIS) is the big unknown in global sea-level rise projections. The warming Southern Ocean is flowing under the WAIS, so it’s melting and losing mass. If the East Antarctic Ice Sheet (EAIS) starts to break up, we can’t stop it. It all comes down to a matter of 2°C.
This project aims to
- determine how marine-based ice sheets will respond to a world that is 2°C warmer
- identify the global, local and regional impacts of this response
- uncover the consequences of warming above 2°C
To achieve these objectives we are
- analysing a 764m long core collected from Roosevelt Island on the Ross Ice Shelf
This will give us the first detailed reconstruction of the WAIS during the last interglacial period – 130,000 to 115,000 years ago.
At this time, global mean temperature was up to 1.5°C warmer and global sea level was 6–9m higher than the pre-industrial period. The Ross Ice Shelf boundary between ice on land/ice on the sea floor retreated over 1,000km.
About the ice sheets
The East Antarctic Ice Sheet (EAIS) is the more dynamic and larger of the two ice sheets.
- colder because it reaches high into the atmosphere
- 3km thick and 55m above sea level
- deep basins below sea level which must have contributed in the past more than the WAIS or Greenland
- is almost certainly a lost cause even with the Paris Agreement – 20 years from now, the loss will be irreversible
- will start an unstoppable journey to melting if we exceed a 2°C rise in global temperatures
The West Antarctic Ice sheet (WAIS) is thinner, smaller and warmer.
- ice thicknesses of up to 2000 m, but largely below sea level. The maximum altitude of the ice surface is less than 2000 m above sea level
- 23km deep and 5m above sea level
- probably collapsed during the last interglacial period
- losing mass where it meets the ocean
- especially vulnerable, as much of its ice sheet lies above the warming Southern Ocean
Why deglaciation of the WAIS is so important
Five key things you need to know:
- Scientists estimate the WAIS has been shedding nearly 150 billion tonnes of mass each year since 2005 – much faster than we first thought. This is what those billion tonnes look like.
- We have recent and unpredicted collapses of multiple ice shelves.
- What happens to the Ross Ice Shelf, a major drainage pathway of the WAIS?
- Wind-driven warmer currents called the Circumpolar Deep Water are reaching under the ice shelves and thinning them out.
- The surface temperature warms, sea ice changes, and the bedrock will go through a gravitational adjustment as ice mass is lost.
What we know
The more ice below sea level, the more sensitive it is: Nothing melts ice like water.
Ice sheets and glaciers have dominated sea rise since 2006 – and sea level rise has risen fourfold since then. In other words – it’s fast.
There are two scenarios for 2100:
- we’ve lowered emissions and sea-rise around New Zealand is about 55cm
- we haven’t lowered emissions and sea-rise hits 1m or more
Even a 10cm rise in sea level will triple coastal inundation. Imagine what that means for Auckland’s Tamaki Drive and Wellington’s south coast. The capital’s waterfront diver statue shows what’s likely to happen with sea-level rise in Wellington Harbour.
For many places in New Zealand, the 1-in-25 year/100-year flooding could become annual; coastal areas dry in 1900 are now inundated regularly.
Once sea-level rise begins, it will continue for millennia.
Research programme details
Collaborators: University of Copenhagen, Oregon State University, University of Washington, Victoria University of Wellington, British Antarctic Survey, Scripps Institution of Oceanography
Duration
2021–2023
Funding platform
Marsden Fund
Status
Active
Leader
Associate Professor Nancy Bertler, VUW/GNS Science