Vertical land movementHow do you measure vertical movement along our ever-changing coastline?
The rise and fall of our coastline has a direct impact on local sea level. Measuring this movement is not as simple as it sounds. GNS Science found a way, creating our first map of vertical land movement.
Overview
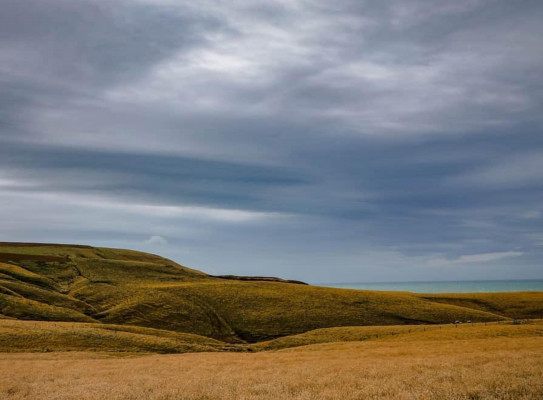
It’s harder than you think to measure the rise and fall of our coastline. The Earth is changing shape as the last great ice sheets retreat. We live on a plate boundary where one plate is diving under another, changing coastlines and causing earthquakes. Traditional methods such as tide gauges simply aren’t enough.
While rising coastal land may lessen the effects of sea-level rise on coastal communities and infrastructure, it’s more complex than that, because vertical movement also involves land going down. For example, we have low-lying areas where we often pump out water for farming, industry, houses and airports. These areas are at risk with vertical land movement.
This project aimed to
- Create New Zealand’s first continuous map of vertical land movement (VLM) around our 15,000 km-long coastline
- Provide geological estimates of VLM to predict future changes in our coastline because what happens in the past can help us forecast the future
To achieve these aims, our objectives were to
- Combine spaceborne, geodetic observations from Interferometric Synthetic Aperture Radar (InSAR) and Global Navigation Satellite Systems (GNSS) to increase both the spatial extent and density of VLM estimates around the entire coastline
- Obtain historical InSAR images acquired by the European Space Agency’s Envisat satellite between 2003 and 2011, which minimised the influence of some of the larger earthquakes since 2009
The project
What is happening to our coastline and why?
Earth’s land surface changed shape with the recession of the last ice sheets. Land that carried the bulk of those sheets is rising, including much of the Northern Hemisphere, Antarctica’s continental shelves and our South Island. Technically, this is glacial isostatic adjustment (GIA).
The vertical position of our coastlines is also changing thanks to living on a plate boundary. Satellites show that parts of our coast are rising by 1 cm a year and others sinking by up to 5 mm a year.
Conventional methods to measure vertical movement along our 15,000km-long coastline is near impossible. You need satellites – in this case, InSAR and GNSS, which provide spaceborne geodetic observations.
GNSS helps accurately determine vertical and lateral movement at sites along our coast, but it doesn’t include many other regions of interest, such as coastal deltas and sedimentary basins where urban areas are often located. However, when we combine GNSS and InSAR, we get an almost continuous estimate of VLM around our coastline. It’s so accurate that we can detect millimetre-sized surface displacements.
Subsidence and low-lying areas
Subsidence (or "sinking") often happens in low-lying areas, deep-seated sedimentary basis or deltas usually filled with soft sediment. This sinking can be accelerated when we pump out water to use the land for farming, industry, housing or airports. As you’d expect, these regions are the most susceptible to sea-level rise – and we have plenty of them. The Waikato coast, Hauraki Plains, mid to lower eastern North Island, Marlborough, Nelson, Wellington and Dunedin are regions where sea-level rise will happen faster.
What we found
We created the first VLM map of our coastline using historical InSAR images acquired by the European Space Agency’s Envisat satellite between 2003 and 2011. This early data is important, as it minimises the influence of some of the larger earthquakes since 2009.
We measured the amount of VLM using global positioning satellite technology and radar systems mounted on Earth-observing satellites such as Envisat and Sentinel. We now know that parts of our coast are rising at a rate of 1 cm every year and others are sinking by as much as 5 mm per year.
The estimated vertical rates show large variability around the country resulting from volcanic, tectonic and anthropogenic (human) sources.
- Along the east coast of the North Island, there is evidence of extensive subsidence of up to about 5mm-1 per year with a general increase in magnitude from north to south. This can be largely attributed to the ongoing subduction of the Pacific Plate beneath the North Island.
- Across the Bay of Plenty, there is an approximately 30 km-long region of uplift that reached 10mm-1 per year over the observation period. This has been associated with the 2005-2009 Matata earthquake swarm, with a drop in uplift rates after this date.
- The top of the South Island, north of Kaikōura, shows subsidence of 2-3 mm-1 per year. However, this area was dramatically uplifted during the 2016 quake.
With the additional complexity of earthquake events such as Matata and Kaikōura, which can distort readings, estimating the evolution of coastal VLM poses an ongoing problem.
Why this is important
VLM may lessen the effects of sea-level rise on coastal communities and infrastructure. If we eliminate present-day earthquake-cycle deformation, we can use geological estimates of VLM to predict future changes.
Regions such as the Hikurangi subduction have strong earthquake-cycle events resulting in VLM, and this may help us forecast motion in the next few decades.