Nitrates
Nitrate is the most widespread groundwater contaminant in the world, contributing to algal blooms and posing a human health hazard to drinking water.
Monitoring freshwater and groundwater
GNS Science has a long history of monitoring and assessment studies of groundwater and freshwater systems to evaluate the source and fate of nitrates using a dual stable isotope nitrate approach.
Our stable isotope laboratory undertakes the analysis and measurement of nitrate concentration. Combined with other groundwater evaluation parameters and water chemistry, we can determine the age, transportation, fate and source of nitrate contaminants, and estimate the rate of remediation over time.
-
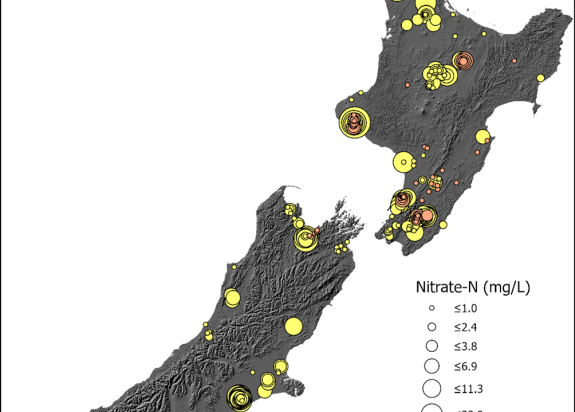
National database of nitrate isotopes
A national database of nitrate isotopes has been collated for more than 1,000 New Zealand surface water and groundwater samples collected nationwide (Rogers et al. 2021). This dataset was used to study nitrate sources and environmental processes affecting groundwater and surface water nitrates determined using stable nitrogen and oxygen isotopes of nitrate. This research showed that the majority of nitrates in New Zealand’s freshwater originate from urine, urea and fertiliser. The dual isotope approach combined with nitrate concentrations allowed identification of these source signals, compared to traditional approaches that would have identified them as natural soil organic nitrogen. We recommend a comprehensive dual isotope approach for New Zealand to identify waters and freshwater contaminants from specific land-use activities.
-
The Denitrification process
Denitrification is a natural process that is mediated by the metabolism of microorganisms where dissolved nitrate is eventually reduced to environmentally inert nitrogen gas (see Equation 1 below).
NO³→ NO² → NO(g) → N²O(g) → N²(g) Equation 1
Nitrate attenuation factors, which quantify denitrification and other nitrate removal processes, are thus an important consideration in water resource management within New Zealand, namely setting nitrogen load limits for hydrological catchments. To understand the quantitative effect of denitrification on catchment-scale N budgets, information on the redox status of groundwater systems needs to be reconciled with denitrification data to confirm actual denitrification. Measurement of ‘excess N²’, the product of the denitrification reaction (N²g) in Equation 1 above), is a promising method for assessing the amount of nitrate that has undergone denitrification in an aquifer under natural conditions.
In recent years we have developed an analytical method for the simultaneous measurement of Ne, Ar and N². Although the current method has only analysed a small number of samples, the results have shown that the excess N² method via Ar/Ne/N² can detect denitrification and quantify the amount of nitrate that has undergone denitrification, even at sites with mixed redox states.analytical method for the simultaneous measurement of Ne, Ar and N². Although the current method has only analysed a small number of samples, the results have shown that the excess N² method via Ar/Ne/N² can detect denitrification and quantify the amount of nitrate that has undergone denitrification, even at sites with mixed redox states.