Tsunami simulation models ‘spot on’ after earthquake
A M6.8 earthquake near Stewart Island has allowed us to test and calibrate our tsunami models in an area of New Zealand that we’re actively working in to better understand seismicity.
The test has shown positive results and improves our model, meaning we can now more confidently and rapidly forecast potential tsunami reaching New Zealand shores.
Shaky isles
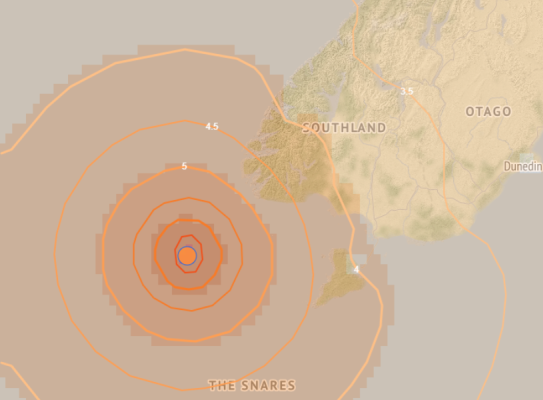
Tuesday 25 March 2025 saw a M6.8 earthquake shake 176 km west of Oban, Stewart Island / Rakiura. Due to the quake’s magnitude, NEMA issued a Tsunami Activity Advisory, and small tsunami waves (reaching a maximum amplitude of ~10 cm) were measured on our coastal tsunami gauge located in south Fiordland.
Accurate modelling
When an earthquake occurs, we need to assess tsunami potential quickly. To do this, we use pre-computed tsunami models, along with first rapid information about the earthquake rupture. We also use any ocean observations that become available from our coastal tsunami gauge and offshore DART networks to confirm and update our tsunami models and forecasts.
With the data we had available following the response, we created a simple rupture scenario to simulate the tsunami wave impact for the lower South Island. This simulated scenario, using our model, showed a very good match with what we observed for the first waves at the Fiordland gauge. This gives us further confidence in our models to forecast tsunami threats.
What locals felt
We received over 5000 Felt Reports and 246 Felt Detailed questionnaires, with most contributions coming from users in Southland. This event gave us an opportunity to look at what people reported feeling from the earthquake and what they did following the shaking.
This valuable information strengthens our understanding of community responses to earthquakes and helps us and our partners improve future preparedness efforts.
-
Tell me more about the felt reports
The Felt Detailed data tells us that three people described the shaking as severe, 21 as strong, 81 as moderate, 67 as “a jolt or mild but unmistakably an earthquake,” and 56 as “gentle, hardly recognisable as an earthquake.” Two participants reported “heard but not felt,” and 15 selected other.
We gathered insights about tsunami risk perceptions and evacuation behaviour too. Of those who felt the earthquake, 48 believed the event could trigger a tsunami, 74 were unsure, and 93 said no. Regarding evacuation, nine respondents evacuated, three took other actions, and 57 stated it was not applicable, while the remaining 175 did not evacuate (as most were already located inland).
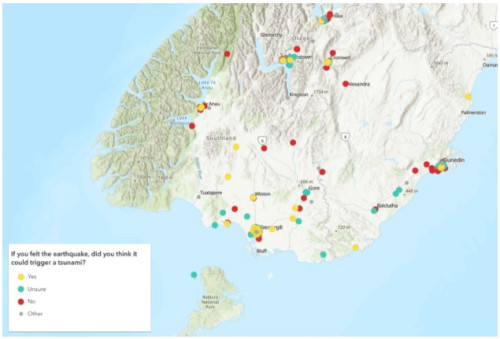
Felt Detailed reports displaying how people who felt the shaking, thought the earthquake could trigger a tsunami.
We really appreciate the time respondents took to provide their detailed observations, which greatly helps our understanding of earthquake experiences and allows us to give advice to decision-makers about what’s needed to help preparedness across the motu.
If you would like to contribute following any earthquakes you can find more information at Earthquake Felt Reports – Felt Detailed (external link)
-
Tsunami modelling results
After the response, tsunami simulations were run with our in-house model COMCOT using a set of nested grids, that allow us to refine the resolution of the simulation along the coast including at the location of the tsunami gauge.
The simulated time series at the gauge location, using our current preferred model, shows a very good match with what we observed for the first few waves at the gauge. However, our simulation also produced a couple of other ~10cm waves at around 1 hour and 45 minutes which were not observed in the real dataset. This may be the result the quality of reproduction of the local geomorphology in our high-resolution Digital Elevation Model (DEM) as it is area which is both complex and not well understood.
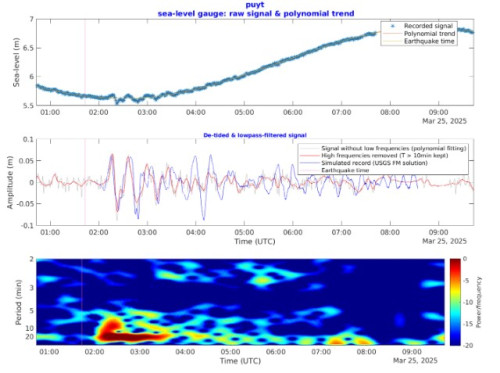 The record of the 25 March 2025 tsunami on PUYT coastal tsunami gauge shows: (top) raw signal with a sampling rate of 15 seconds; (middle) detided and filtered signal in red, and simulated signal in blue; (bottom) spectrogram of the detided signal.
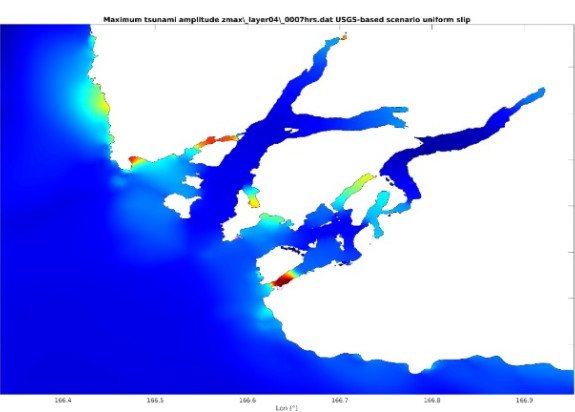
The maximum amplitude maps calculated in the simulation, and more specifically in the region around the coastal gauge, can be used to help identify places which might have resulted in wave amplification due to local phenomenon (e.g., resonance). This means they may have had maximum amplitudes larger than the one recorded at the gauge.
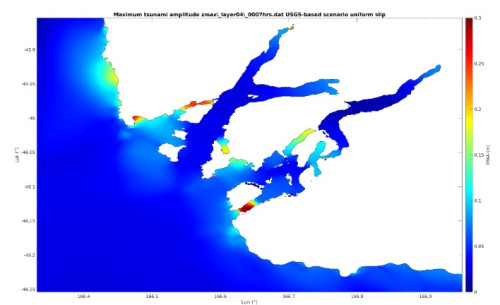
The image above shows the maximum water depth map around the coastal gauge in Welcome Bay. Even though the tsunami at the gauge did not reach more than 10cm, there are a several places nearby which are modelled to have experienced tsunami amplitudes above the beach and marine threshold of 30cm, especially along some beaches and in narrow inlets. There is an inlet in the south of Coal Island where the simulated maximum amplitude reached more than 65cm. This is a good illustration that the maximum we observed at a gauge is not necessarily the same as the maximum observed everywhere along a stretch of coastline. Local bathymetric features, like narrow inlets, can amplify the amplitude considerably, even for places not that far away from the gauge.
Ideally, we would have advanced tsunami models available as quickly as possible, and New Zealand is working on this significant challenge alongside the global scientific community. In recent years, we have made progress testing and implementing several near real-time tools that rapidly characterise an earthquake rupture, and help assess its tsunami potential – such as the RCET programme. Some of these tools were used by science responders following the Puysegur earthquake.