Pacific Ocean sea-level records of the 5 March 2021 triplet of tsunamis
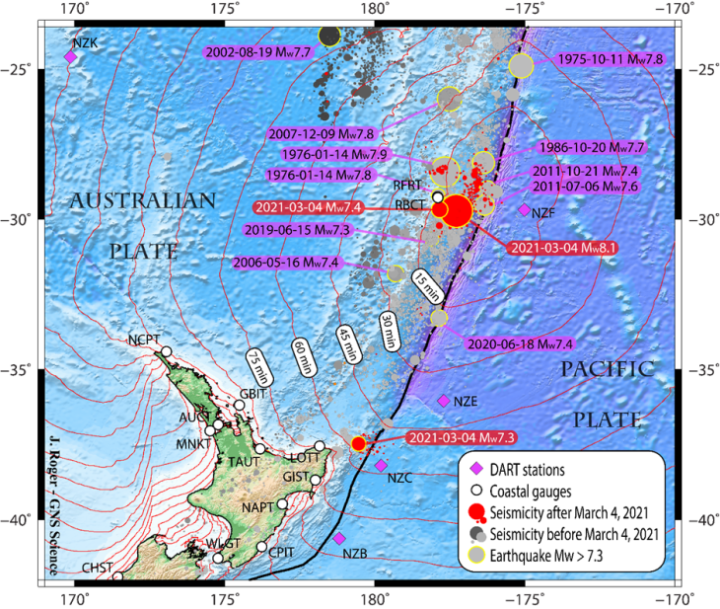
On 5 March 2021, at 2.27 AM local time (4 March 2021, 13:27:34 UTC), a Mw 7.3 earthquake woke up the North Island of New Zealand with strong and long shaking. Its epicentre was located about 170 km NE offshore Gisborne in the Hikurangi subduction zone.
This was the first tsunami of a triplet occurring on the same day. It was soon followed by a tsunami information statement from the Pacific Tsunami Warning Center (PTWC), the French Polynesia Tsunami Warning Center (CPPT) and New Zealand’s National Geohazards Monitoring Centre (NGMC) at GNS Science, based on the earthquake location and magnitude, and the newly deployed New Zealand DART (Deep-ocean Assessment and Reporting of Tsunami) stations’ measurements (Figure 2) (for more information about the New Zealand DART network, see Fry et al., 2020). The tsunami propagated from the source region to the north shore of New Zealand, with a very localised and limited impact.

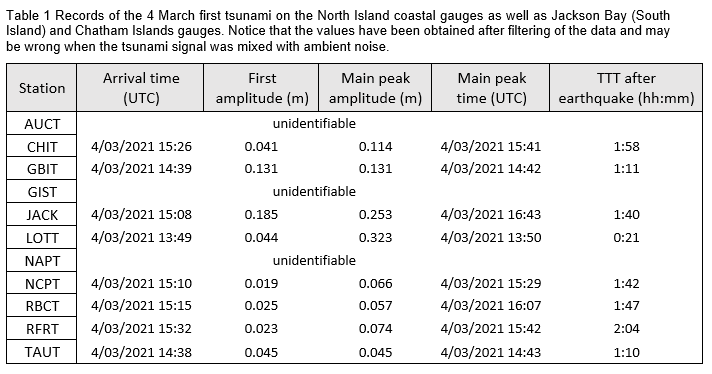
Maximum amplitudes of ~32.3 cm and ~6.6 cm were respectively recorded at East Cape (LOTT) and North Cape (NCPT) coastal tsunami gauges (Table 1), located ~105 km and ~660 km away from the epicentre. Further analysis of seismic waves by seismological observatories (USGS, GCMT) provided a hypocentre depth of 50-52 km and an oblique reverse faulting mechanism. A few hours later, the tsunami warning issued by the National Emergency Management Agency (NEMA) in New Zealand was cancelled for this first event due to low threat levels.
At 6.41 AM (17:41:23 UTC), 4 hours and 14 minutes later, another earthquake triggered a tsunami in the southwestern Pacific region with a magnitude Mw 7.4 earthquake. This was located further north (~ 900 km) than the previous one, 50 km south of Raoul Island (New Zealand) on the Kermadec subduction zone (USGS location: 29.677°S, 177.840°W; Figure 1) at a depth of between 42-43 km, and very close to the epicentres of the 1976 similar doublet of megathrust earthquakes (Todd and Lay, 2013). This event was a bit stronger than the first earthquake but located further away from New Zealand’s main islands, so the generated tsunami was smaller at the New Zealand coast, and mainly only recorded by DART stations (Figure 2). Its signal appears to be hidden in the noise of the previous and following tsunamis on the coastal gauges of New Zealand.
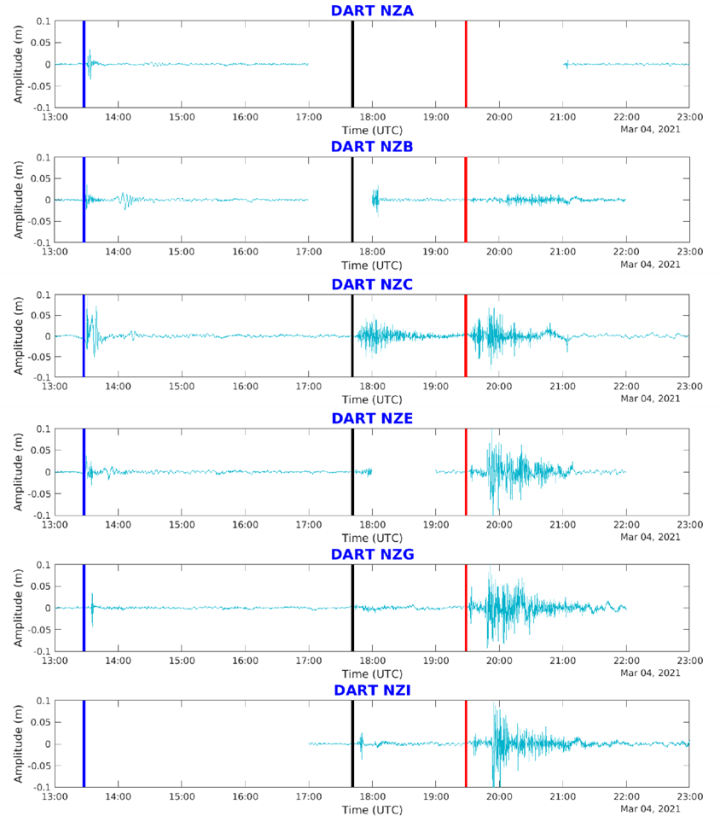
At 8.28 AM (19:28:33 UTC), 1 hour and 47 minutes later, a Mw 8.1 earthquake occurred very close to the earlier Mw 7.4 earthquake, 80 km southeast of Raoul Island (USGS location: 29.723°S, 177.279°W; Figure 1) at a depth of 28-34 km. It triggered a third tsunami and warnings from the different tsunami warning centres and was rapidly confirmed by the New Zealand DART stations’ measurements (Figure 2). The waveforms recorded by the DART stations were immediately used in an inversion process to estimate the initial sea-surface deformation. This was then used in the response strategy for direct simulation of tsunami wave amplitudes and phenomenon duration to expect at the coastlines (Kornei, 2021).
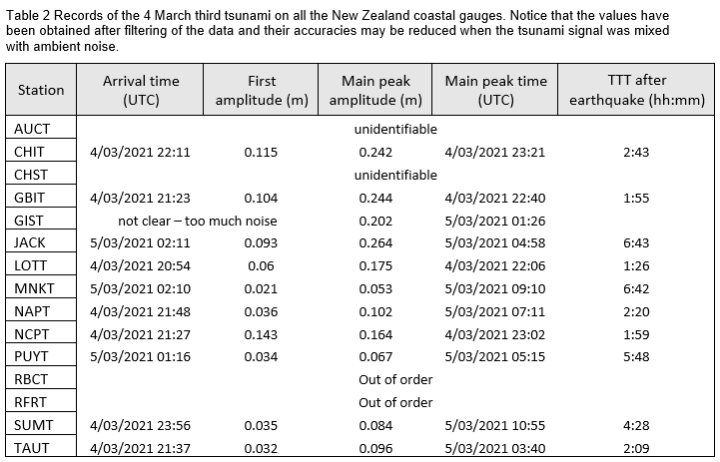
Unfortunately, the nearby coastal gauges located on Raoul Island itself were disconnected immediately during the shake, and no further data was transmitted until the station was reconnected five days after the earthquake. It then took about 1 hour and 20 minutes for the tsunami to travel to the next closest gauges located in East Cape (LOTT), New Zealand and Nukualofa Harbour, Kingdom of Tonga, and nearly 2 hours to reach Great Barrier Island (GBIT) and North Cape (NCPT), New Zealand (Figure 1). The main amplitude of this tsunami in New Zealand corresponds to ~26 cm recorded at Jackson Bay more than 9 hours after the earthquake, the signal being delayed when travelling across the Challenger Plateau off the West Coast and then emphasised by some local resonance inside the bay. The arrival times and amplitudes of the first and main waves at the New Zealand coastal gauges are shown on Table 2. The propagation of the three tsunamis at a regional scale is shown on the animation below.
Animation showing propagation of the three tsunamis at a regional scale.
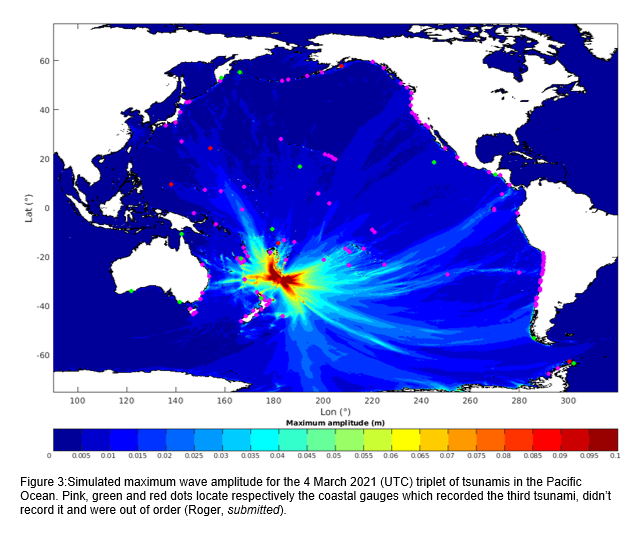
As expected with such earthquake magnitude and confirmed by numerical modelling, it appears that this tsunami didn’t stay within the southwestern Pacific region as the two previous ones. In fact, like the 14 January, 1976 Mw 7.8 and 7.9 doublet earthquakes did, the tsunami travelled across the Pacific Ocean, where it has been recorded by most gauges located in oceanic islands and all along the coast from the Antarctica Peninsula in the south, to Japan, the Aleutian Islands, the USA and Canada coasts in the north (Figure 3).
Maximum tsunami amplitudes of 65 cm and 48 cm were recorded at the Norfolk Island and Galapagos coastal gauges respectively which represents between two and three times more than what has been recorded on northern New Zealand coastal tsunami gauges (North Cape - NCPT, East Cape - LOTT, Great Barrier Island - GBIT), highlighting the effect of directivity of tsunami waves as shown in previous studies. Nevertheless, it is to note that testimonies coming from exposed locations related tsunami waves of maximum 50 cm in northern New Zealand like in Tutukaka Harbour, Whangarei District (Roger, in review). Figure 3 highlights the Pacific-wide impact of this tsunami from the Kermadec subduction zone neighbourhood to the eastern shores of the Pacific Ocean and the important role of oceanic structures (ridges, islands groups, oceanic basins, etc.).
How to cite :
Roger, J. (2021). Pacific Ocean sea-level records of the 5 March 2021 triplet of tsunamis. GNS Science webpage, Accessed at GNS Science on [insert date].
-
References
De Lange, W.P., Healy, T.R. (1986). New Zealand tsunamis 1840-1982. New Zealand Journal of Geology and Geophysics, 29(1), 115-134, https://doi.org/10.1080/00288306.1986.10427527(external link).
Fry, B., McCurrach, S.-J., Gledhill, K., Power, W., Williams, M., Angove, M., Arcas, D., Moore, C. (2020). Sensor network warns of stealth tsunamis. EOS, 101, https://doi.org/10.1029/2020EO144274(external link), Published on 26 May 2020.
Gusman, A. (2021). Tsunami DART observations and simulation of the 2021 Raoul Island Mw 8.1 earthquake. GNS Science. https://doi.org/10.21420/FQT1-TR97(external link).
Kornei, K. (2021). Ocean Sensors Record Rare Triple Tsunami near New Zealand. EOS, 102, https://doi.org/10.1029/2021EO157676(external link), Published on 29 April 2021.
Luis, J., (2007). Mirone : A multi-purpose tool for exploring grid data. Computers & Geosciences, 33(1), 31-41, https://doi.org/10.1016/j.cageo.2006.05.005(external link).
Roger, J. (2021). 5 March 2021 post-tsunami field survey in Whangarei. GNS Science Report, 10 pp. in review.
Strasser, F.O., Arango, M.C., Bommer, J.J. (2010). Scaling of the source dimensions of interface and intraslab subduction-zone earthquakes with moment magnitude. Seismological Research Letters, 81(6), 941-950, https://doi.org/10.1785/gssrl.81.6.941(external link).
Todd, E.K., Lay, T. (2013). The 2011 Northern Kermadec earthquake doublet and subduction zone faulting interactions. Journal of Geophysical Research, Solid Earth, 118(1), 249-261, https://doi.org/10.1029/2012JB009711(external link).