Hunga Tonga - Hunga Ha’apai volcano-induced sea level oscillations and tsunami simulations
The eruption of Hunga Tonga – Hunga Ha’apai volcano on 15 January 2022 resulted in widely observed sea level changes at coastal gauges and DART buoy stations around the world, and particularly in the Pacific.
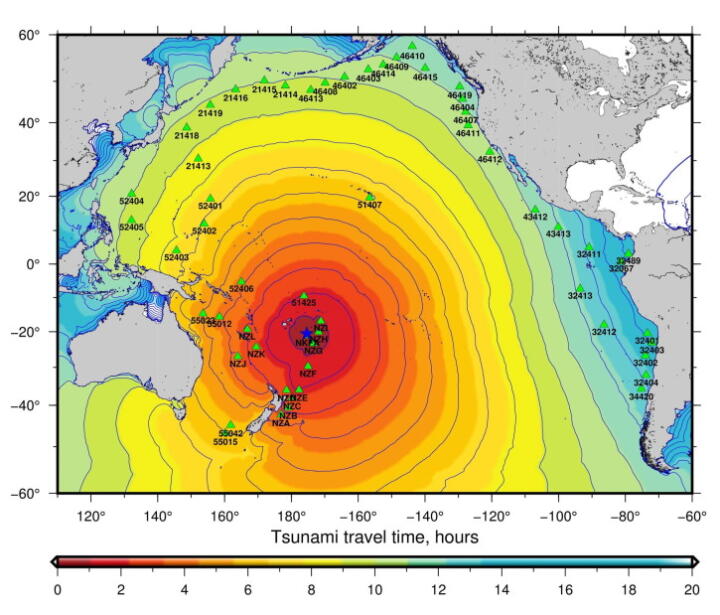
The volcano is a part of the Tonga-Kermadec arc and is located ~67 km north-northwest of Nuku’alofa at 20.57° S and 175.38° W, the capital city of the Kingdom of Tonga (Colombier et al., 2018; Garvin et al., 2018). Based on the Himawari-8 satellite images the largest eruption occurred sometime between 4:00 – 4:10 UTC, and a tsunami may have been generated within this time. For the tsunami arrival time comparison below, we assumed that the tsunami was generated at 4:00 UTC. Tides and short period (<2 min) waves were removed from the original record to reveal tsunami-like waves, but the filtered waves may not consist purely of tsunami waves that have propagated from the source.

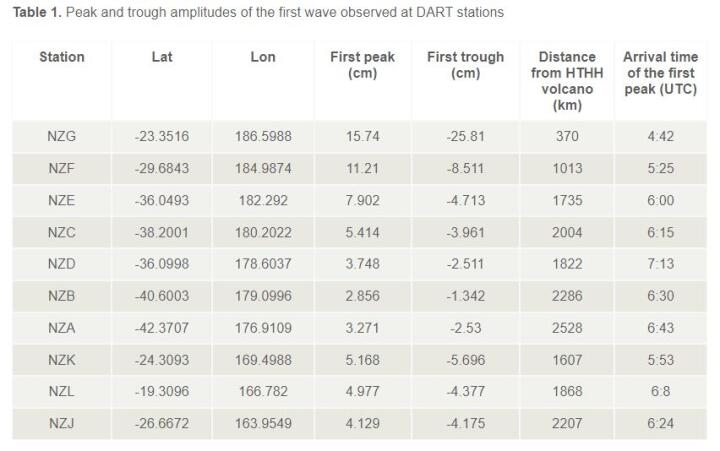
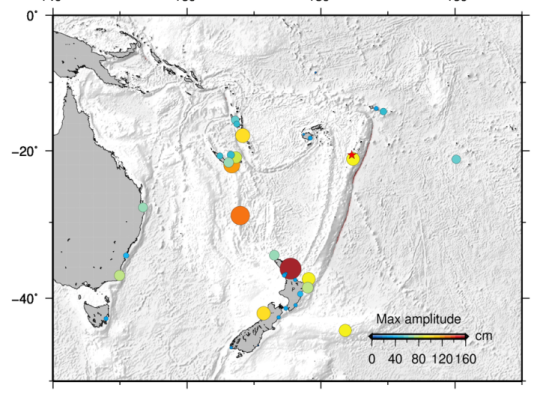
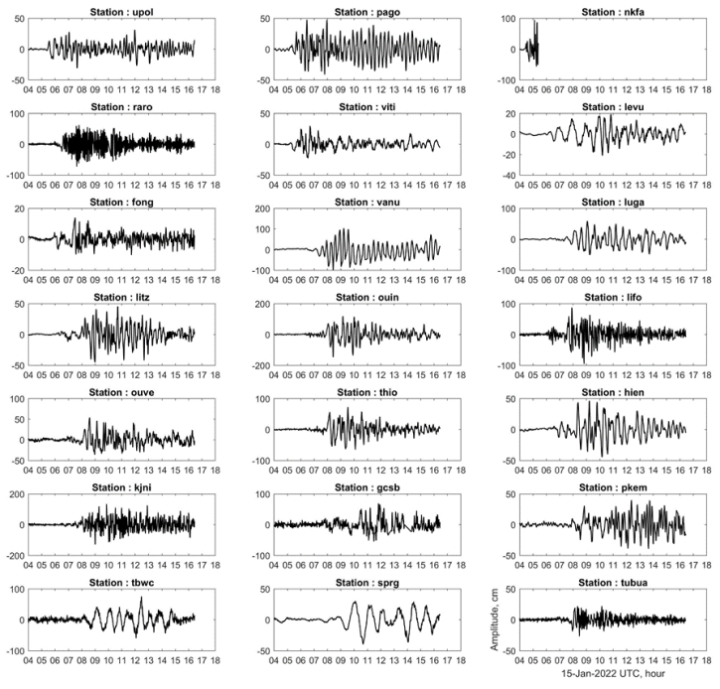
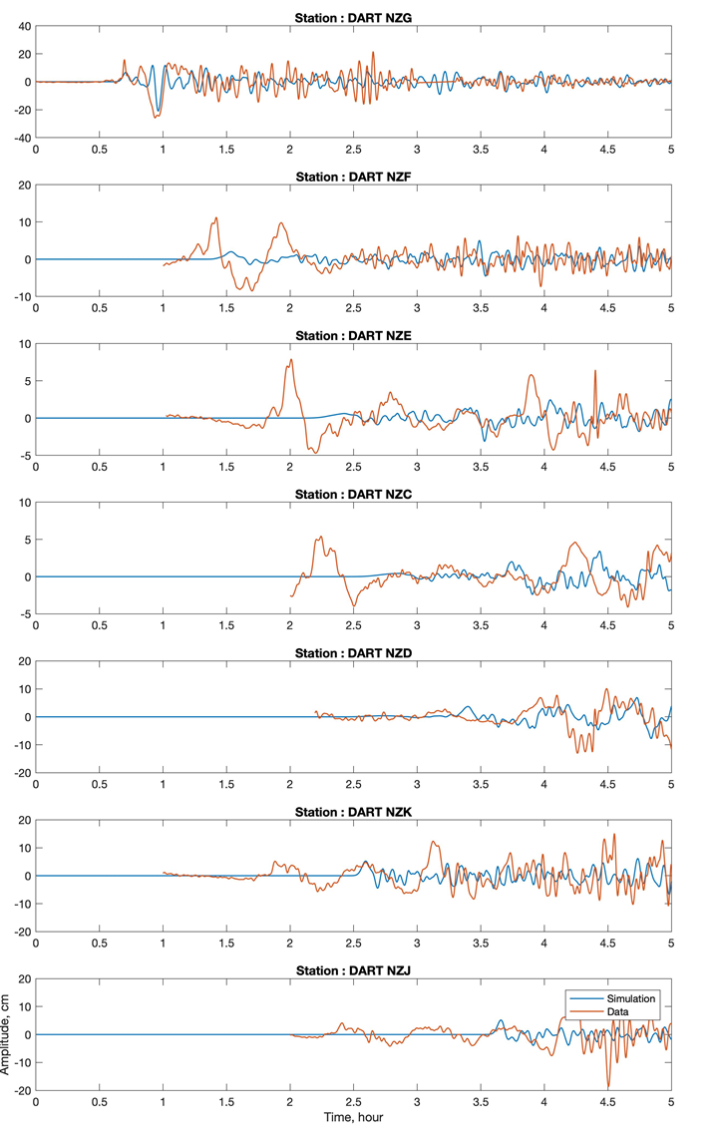
The arrival time, and peak amplitude of the first wave recorded at the New Zealand DART stations (Fry et al., 2020) are shown in Table 1 and Figure 2. The maximum amplitude of the waves recorded by coastal gauges are shown in Table 2, Figure 3, and Figure 4. At DART NZG, the closest New Zealand DART from the volcano, the maximum amplitude was ~20 cm, and the largest crest-to-trough height was ~40 cm (Figure 2). The largest observed amplitude was typically not in the first wave and often occurred several hours after the initial wave (Figure 3 and Figure 4). Some components of these waveforms may be a consequence of pressure changes caused directly by the volcanic shockwave rather than changes in water surface level, though this is still being evaluated (see below).

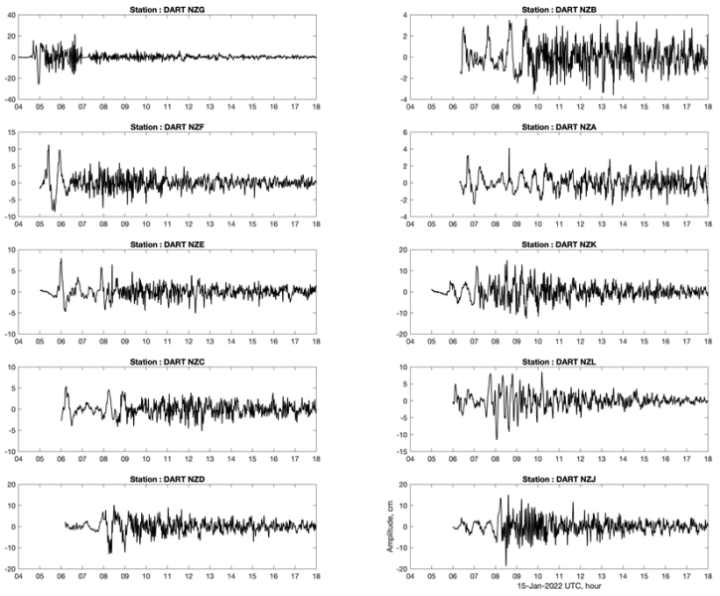
Generally, the records show a set of long-period waves either followed or superimposed with higher frequency waves. In some locations (e.g. PKEM-Port Kembla and TBWC-Twofold Bay, Australia, SPRG-Spring Bay, Tasmania, and DART NZB, New Zealand), these first waves have a recorded period of ~1 hour. In other places, these first waves show periods of several minutes to a few tens of minutes (e.g. HUAHI-Huahine, French Polynesia, LIFO-Lifou, New Caledonia). This may be an indication that the waves propagated in a non-isotropic pattern (and perhaps also that some locations are sensitive to different components of the propagating waves). At the time of tsunami propagation a cyclone (Cody) was located between Tonga and New Zealand, consequently the coastal gauges in New Zealand recorded the combined influences of both the tsunami and the cyclone.
Tsunami Simulation
There are at least eight known volcanic source mechanisms which include 1) underwater explosion, 2) pyroclastic flow, 3) earthquake, 4) flank failure, 5) caldera subsidence, 6) shock wave, 7) lahar, and 8) collapse of lava bench (Paris et al., 2014, 2015). The tsunami from Hunga Tonga – Hunga Ha’apai volcano eruption could have been generated by any or a combination of these mechanisms. We simulated the tsunami using a simple circular sea surface deformation model with a characteristic diameter of 10 km. This kind of circular model can be used to roughly model an underwater explosion or a caldera collapse mechanism. A tsunami numerical model that solves the linear shallow water equations (Satake, 1995) was used to simulate the tsunami. The simulated long waves were then corrected using the Watada et al. (2014) method to include dispersion effects.
The uplift of initial sea surface deformation model was adjusted to fit the tsunami amplitude recorded at DART NZG, the closest DART buoy station from the volcano. However, the arrival time and amplitude of the simulated waveforms cannot match the observations at the other DART buoys. We found that the arrival time difference between the observed and simulated wave becomes larger at DART stations farther away from the source. As an example, the tsunami at DART NZE arrived about 30 min earlier than the simulation, and the observed peak amplitude is much larger than the simulated one (Figure 6). This result suggests that the tsunami source mechanism was very complex.
The earlier observed tsunami arrival time may suggest that a component of the tsunami source could be from the shock wave of the eruption. This is also suggested by the far-field observations of sea-level oscillations in regions like the Mediterranean and the Caribbean (e.g. Palermo in Sicily and Carloforte in Sardinia for the Mediterranean, Fort de France in Martinica for the Caribbean; Figure 7) that are well-protected from any tsunami from Tonga propagating through the ocean. Other mechanisms that could have been contributed to the tsunami generation in this event include underwater explosion, pyroclastic flow, caldera collapse and flank failure. The investigation of the tsunami source mechanism is currently still underway.
How to cite :
Gusman, A.R. & Roger, J. (2022). Hunga Tonga - Hunga Ha’apai volcano-induced sea level oscillations and tsunami simulations. GNS Science webpage, Accessed at GNS Science on [insert date].
-
Acknowledgements
The New Zealand coastal gauge and New Zealand DART station data are available from GEONET, while the coastal gauge data in Tonga, Fiji, New Caledonia, Vanuatu, Australia, Italy and Martinica are available from the UNESCO-IOC sea level monitoring site.
We thank David Burbidge, Xiaoming Wang, and William Power for their comments.
New Zealand DART data (https://doi.org/10.21420/8tcz-tv02(external link))
New Zealand coastal tsunami gauge data (https://doi.org/10.21420/EJ6W-RC96(external link)) -
References
Colombier, M., Scheu, B., Wadsworth, F. B., Cronin, S., Vasseur, J., Dobson, K. J., ... & Dingwell, D. B. (2018). Vesiculation and Quenching During Surtseyan Eruptions at Hunga Tonga‐Hunga Ha'apai Volcano, Tonga. Journal of Geophysical Research: Solid Earth, 123(5), 3762-3779.
Flanders Marine Institute (VLIZ); Intergovernmental Oceanographic Commission (IOC) (2022): Sea level station monitoring facility. Accessed at http://www.ioc-sealevelmonitoring.org on 2022-01-19 at VLIZ. DOI: 10.14284/482(external link)(external link)
Fry, B., McCurrach, S.-J., Gledhill, K.R., Power, W.L., Williams, M., Angove, M., Arcas, D., Moore, C. (2020) Sensor network warns of stealth tsunamis. Eos, 101: DOI: 10.1029/2020EO144274
Garvin, J. B., Slayback, D. A., Ferrini, V., Frawley, J., Giguere, C., Asrar, G. R., & Andersen, K. (2018). Monitoring and Modeling the Rapid Evolution of Earth's Newest Volcanic Island: Hunga Tonga Hunga Ha'apai (Tonga) Using High Spatial Resolution Satellite Observations. Geophysical research letters, 45(8), 3445-3452.
Paris, R., Switzer, A. D., Belousova, M., Belousov, A., Ontowirjo, B., Whelley, P. L., & Ulvrova, M. (2014). Volcanic tsunami: a review of source mechanisms, past events and hazards in Southeast Asia (Indonesia, Philippines, Papua New Guinea). Natural Hazards, 70(1), 447-470.
Paris, R. (2015). Source mechanisms of volcanic tsunamis. Philosophical Transactions of the Royal Society A: Mathematical, Physical and Engineering Sciences, 373(2053), 20140380.
Satake, K. (1995). Linear and nonlinear computations of the 1992 Nicaragua earthquake tsunami. Pure and Applied Geophysics, 144(3), 455-470.
Watada, S., Kusumoto, S., & Satake, K. (2014). Traveltime delay and initial phase reversal of distant tsunamis coupled with the self‐gravitating elastic Earth. Journal of Geophysical Research: Solid Earth, 119(5), 4287-4310